American Express 2014 Annual Report Download - page 37
Download and view the complete annual report
Please find page 37 of the 2014 American Express annual report below. You can navigate through the pages in the report by either clicking on the pages listed below, or by using the keyword search tool below to find specific information within the annual report.-
 1
1 -
2
-
3
-
4
-
5
-
6
-
7
-
8
-
9
-
10
-
11
-
12
-
13
-
14
-
15
-
16
-
17
-
18
-
19
-
20
-
21
-
22
-
23
-
24
-
25
-
26
-
 27
27 -
 28
28 -
 29
29 -
 30
30 -
 31
31 -
 32
32 -
 33
33 -
 34
34 -
 35
35 -
 36
36 -
 37
37 -
 38
38 -
 39
39 -
 40
40 -
 41
41 -
 42
42 -
 43
43 -
 44
44 -
 45
45 -
 46
46 -
 47
47 -
48
-
49
-
50
-
51
-
52
-
53
-
54
-
55
-
56
-
57
-
58
-
59
-
60
-
61
-
62
-
63
-
64
-
65
-
66
-
67
-
68
-
69
-
70
-
71
-
72
-
73
-
74
-
75
-
76
-
77
-
78
-
79
-
80
-
81
-
82
-
83
-
84
-
85
-
86
-
87
-
88
-
89
-
90
-
91
-
92
-
93
-
94
-
95
-
96
-
97
-
98
-
99
-
100
-
101
-
102
-
103
-
104
-
105
-
106
-
107
-
108
-
109
-
110
-
111
-
112
-
113
-
114
-
115
-
116
-
117
-
118
-
119
-
120
-
121
-
122
-
123
-
124
-
125
-
126
-
127
-
128
-
129
-
130
 |
 |

AMERICAN EXPRESS COMPANY
2014 FINANCIAL REVIEW
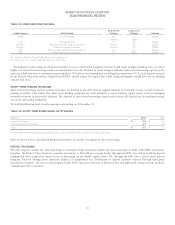
GLOBAL NETWORK & MERCHANT SERVICES SEGMENT
TABLE 16: GNMS SELECTED INCOME STATEMENT DATA
Years Ended December 31,
(Millions, except percentages) 2014 2013 2012
Change
2014 vs. 2013
Change
2013 vs. 2012
Revenues
Discount revenue, net card fees and other $5,426$ 5,229 $ 5,005 $ 197 4% $ 224 4%
Interest income 52 32 23 20 63 9 39
Interest expense (269) (252) (243) (17) 7 (9) 4
Net interest income 321 284 266 37 13 18 7
Total revenues net of interest expense 5,747 5,513 5,271 234 4 242 5
Provisions for losses 93 67 73 26 39 (6) (8)
Total revenues net of interest expense after provisions for losses 5,654 5,446 5,198 208 4 248 5
Expenses
Marketing, promotion, rewards, Card Member services and other 819 704 744 115 16 (40) (5)
Salaries and employee benefits and other operating expenses 2,215 2,273 2,235 (58) (3) 38 2
Total expenses 3,034 2,977 2,979 57 2 (2) —
Pretax segment income 2,620 2,469 2,219 151 6 250 11
Income tax provision 960 894 776 66 7 118 15
Segment income $ 1,660 $ 1,575 $ 1,443 $ 85 5 % $ 132 9 %
Effective tax rate 36.6% 36.2% 35.0%
GNMS operates a global payments network that processes and settles proprietary and non-proprietary card transactions. GNMS acquires
merchants and provides point-of-sale products, multi-channel marketing programs and capabilities, services and data, leveraging the
Company’s global closed-loop network. It enters into partnership agreements with third-party card issuers and acquirers, licensing the
American Express brand and extending the reach of the global network.
TOTAL REVENUES NET OF INTEREST EXPENSE
Discount revenue, net card fees and other revenues increased $197 million or 4 percent in 2014 as compared to 2013. The increase was
primarily driven by higher merchant-related revenues, driven by a 7 percent increase in global card billed business.
Net interest income increased $37 million or 13 percent in 2014 as compared to 2013, and increased 21 percent excluding the impact of
foreign exchange rates.4The increase was primarily driven by increased revenues on our merchant loans. The interest expense credit relates
to internal transfer pricing and funding rates, which resulted in a net benefit for GNMS due to its merchant payables.
Total revenues net of interest expense increased $242 million or 5 percent in 2013 as compared to 2012 primarily due to higher discount
revenue and net interest income.
PROVISIONS FOR LOSSES
Provisions for losses increased $26 million or 39 percent in 2014 as compared to 2013, primarily driven by a merchant-related charge in the
fourth quarter. Provisions for losses decreased $6 million or 8 percent in 2013 as compared to 2012.
EXPENSES
Marketing, promotion, rewards, Card Member services and other expenses increased $115 million or 16 percent in 2014 as compared to
2013, primarily driven by the reinvestment of a significant portion of the gain from the business travel joint venture transaction in growth
initiatives.
Salaries and employee benefits and other operating expenses decreased $58 million or 3 percent in 2014 as compared to 2013, primarily
driven by the proposed merchant litigation settlement in the prior year.
Total expenses decreased $2 million in 2013 as compared to 2012, primarily driven by lower marketing and promotion, professional
services and salary and employee benefit expenses, substantially offset by the proposed merchant litigation settlement in 2013.
4Refer to footnote 1 on page 22 relating to changes in foreign exchange rate.
37