American Express 2014 Annual Report Download - page 27
Download and view the complete annual report
Please find page 27 of the 2014 American Express annual report below. You can navigate through the pages in the report by either clicking on the pages listed below, or by using the keyword search tool below to find specific information within the annual report.-
 1
1 -
2
-
3
-
4
-
5
-
6
-
7
-
8
-
9
-
10
-
11
-
12
-
13
-
14
-
15
-
16
-
 17
17 -
 18
18 -
 19
19 -
 20
20 -
 21
21 -
 22
22 -
 23
23 -
 24
24 -
 25
25 -
 26
26 -
 27
27 -
 28
28 -
 29
29 -
 30
30 -
 31
31 -
 32
32 -
 33
33 -
 34
34 -
 35
35 -
 36
36 -
 37
37 -
38
-
39
-
40
-
41
-
42
-
43
-
44
-
45
-
46
-
47
-
48
-
49
-
50
-
51
-
52
-
53
-
54
-
55
-
56
-
57
-
58
-
59
-
60
-
61
-
62
-
63
-
64
-
65
-
66
-
67
-
68
-
69
-
70
-
71
-
72
-
73
-
74
-
75
-
76
-
77
-
78
-
79
-
80
-
81
-
82
-
83
-
84
-
85
-
86
-
87
-
88
-
89
-
90
-
91
-
92
-
93
-
94
-
95
-
96
-
97
-
98
-
99
-
100
-
101
-
102
-
103
-
104
-
105
-
106
-
107
-
108
-
109
-
110
-
111
-
112
-
113
-
114
-
115
-
116
-
117
-
118
-
119
-
120
-
121
-
122
-
123
-
124
-
125
-
126
-
127
-
128
-
129
-
130
 |
 |

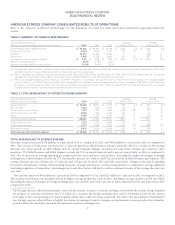
AMERICAN EXPRESS COMPANY
2014 FINANCIAL REVIEW
TABLE 8: SELECTED STATISTICAL INFORMATION
As of or for the Years Ended December 31,
(Millions, except percentages and where indicated) 2014 2013 2012
Change
2014 vs. 2013
Change
2013 vs. 2012
Worldwide Card Member receivables
Total receivables (billions) $ 44.9 $ 44.2 $ 42.8 2 % 3 %
Loss reserves:
Beginning balance 386 428 438 (10) (2)
Provisions(a) 792 648 601 22 8
Net write-offs(b) (683) (669) (640) 2 5
Other(c) (30) (21) 29 43 #
Ending balance $465$386$428 20% (10)%
% of receivables 1.0 % 0.9 % 1.0 %
Net write-off rate – principal only – USCS/ICS(e) 1.7 % (d) (d)
Net write-off rate – principal and fees – USCS/ICS(e) 1.9 % (d) (d)
30 days past due as a % of total – USCS/ICS 1.6 % (d) (d)
Net loss ratio as a % of charge volume – GCS 0.09 % 0.08 % 0.06 %
90 days past billing as a % of total – GCS 0.8 % 0.9 % 0.8 %
Worldwide Card Member loans
Total loans (billions) $70.4$ 67.2 $ 65.2 5 % 3 %
Loss reserves:
Beginning balance 1,261 1,471 1,874 (14) (22)
Provisions(a) 1,138 1,115 1,030 2 8
Net write-offs – principal only(b) (1,023) (1,141) (1,280) (10) (11)
Net write-offs – interest and fees(b) (164) (150) (157) 9 (4)
Other(c) (11) (34) 4 (68) #
Ending balance $1,201$ 1,261 $ 1,471 (5) (14)
Ending reserves – principal only $1,149$ 1,212 $ 1,423 (5) (15)
Ending reserves – interest and fees $52$49$48 6 2
%ofloans 1.7 % 1.9 % 2.3 %
%ofpastdue 167 % 169 % 182 %
Average loans (billions) $ 66.0 $63.3$ 61.5 4% 3%
Net write-off rate – principal only(e) 1.5 % 1.8 % 2.1 %
Net write-off rate – principal, interest and fees(e) 1.8 % 2.0 % 2.3 %
30 days past due as a % of total 1.0 % 1.1 % 1.2 %
Net interest income divided by average loans(f) 8.3 % 8.0 % 7.5 %
Net interest yield on Card Member loans(f) 9.3 % 9.3 % 9.1 %
# Denotes a variance greater than 100 percent.
(a) Provisions for principal (resulting from authorized transactions), interest and/or fees on Card Member loans and principal (resulting from authorized
transactions) and fee reserve components on Card Member receivables.
(b) Write-offs, less recoveries.
(c) Card Member receivables includes a reclassification of card-related fraud losses of $(7) million to other liabilities in 2014; foreign currency translation
adjustments of $(15) million, $(4) million and $2 million for the years ended December 31, 2014, 2013 and 2012, respectively; a reclassification of Card Member
bankruptcy reserves of $18 million from other liabilities to credit reserves in 2012; and other adjustments of $(8) million, $(17) million and $9 million for the
years ended December 31, 2014, 2013 and 2012, respectively. Card Member loans includes a reclassification of card-related fraud losses of $(6) million to other
liabilities in 2014; foreign currency translation adjustments of $(17) million, $(12) million and $7 million for the years ended December 31, 2014, 2013 and 2012,
respectively; a reclassification of Card Member bankruptcy reserves of $4 million from other liabilities to credit reserves in 2012; and other adjustments of $12
million and $(22) million and $(7) million for the years ended December 31, 2014, 2013 and 2012, respectively.
(d) Historically, net loss ratio as a % of charge volume and 90 days past billing as a % of receivables were presented for ICS. Beginning in the first quarter 2014, as a
result of system enhancements, 30 days past due as a % of total, net write-off rate (principal only) and net write-off rate (principal and fees) have been
presented.
(e) We present a net write-off rate based on principal losses only (i.e., excluding interest and/or fees) to be consistent with industry convention. In addition,
because our practice is to include uncollectible interest and/or fees as part of our total provision for losses, a net write-off rate including principal, interest and/
or fees is also presented.
(f) Refer to Table 9 for the calculation of net interest yield on Card Member loans, a non-GAAP measure, net interest income divided by average loans, a GAAP
measure, and our rationale for presenting net interest yield on Card Member loans.
27