American Express 2014 Annual Report Download - page 23
Download and view the complete annual report
Please find page 23 of the 2014 American Express annual report below. You can navigate through the pages in the report by either clicking on the pages listed below, or by using the keyword search tool below to find specific information within the annual report.-
 1
1 -
2
-
3
-
4
-
5
-
6
-
7
-
8
-
9
-
10
-
11
-
12
-
 13
13 -
 14
14 -
 15
15 -
 16
16 -
 17
17 -
 18
18 -
 19
19 -
 20
20 -
 21
21 -
 22
22 -
 23
23 -
 24
24 -
 25
25 -
 26
26 -
 27
27 -
 28
28 -
 29
29 -
 30
30 -
 31
31 -
 32
32 -
 33
33 -
34
-
35
-
36
-
37
-
38
-
39
-
40
-
41
-
42
-
43
-
44
-
45
-
46
-
47
-
48
-
49
-
50
-
51
-
52
-
53
-
54
-
55
-
56
-
57
-
58
-
59
-
60
-
61
-
62
-
63
-
64
-
65
-
66
-
67
-
68
-
69
-
70
-
71
-
72
-
73
-
74
-
75
-
76
-
77
-
78
-
79
-
80
-
81
-
82
-
83
-
84
-
85
-
86
-
87
-
88
-
89
-
90
-
91
-
92
-
93
-
94
-
95
-
96
-
97
-
98
-
99
-
100
-
101
-
102
-
103
-
104
-
105
-
106
-
107
-
108
-
109
-
110
-
111
-
112
-
113
-
114
-
115
-
116
-
117
-
118
-
119
-
120
-
121
-
122
-
123
-
124
-
125
-
126
-
127
-
128
-
129
-
130
 |
 |

AMERICAN EXPRESS COMPANY
2014 FINANCIAL REVIEW
Travel commissions and fees decreased $795 million or 42 percent in 2014 as compared to 2013, and $27 million or 1 percent in 2013 as
compared to 2012. The decrease in 2014 as compared to 2013 was primarily due to the business travel joint venture transaction, resulting in a
lack of comparability between periods. The decrease in 2013 as compared to 2012 was primarily driven by flat business travel sales and a 2
percent decline in U.S. consumer travel sales.
Other commissions and fees increased $94 million or 4 percent in 2014 as compared to 2013, and $97 million or 4 percent in 2013 as
compared to 2012. The increase in 2014 as compared to 2013 was primarily driven by higher revenue from our Loyalty Partner business and
delinquency fees. The increase in 2013 as compared to 2012 was primarily driven by lower Card Member reimbursements and marginally
higher delinquency fees and foreign currency conversion revenues, as well as higher revenue from our Loyalty Partner business.
Other revenues increased $715 million or 31 percent in 2014 as compared to 2013 and decreased $151 million or 6 percent in 2013 as
compared to 2012. The increase in 2014 as compared to 2013 was primarily driven by the $719 million gain on the sale of our investment in
Concur, revenues received for transitional services provided to the GBT JV and higher Loyalty Edge revenues, partially offset by the loss of
revenue from the publishing business, which was sold in the fourth quarter of 2013. The decrease in 2013 as compared to 2012 was driven by
the effect of a benefit in the first half of 2012 due to revised estimates of the liability for uncashed Travelers Cheques in certain international
countries. The 2013 decrease also includes the loss of revenue from the publishing business in the fourth quarter of 2013, and higher Card
Member reimbursements within other revenues in 2013 as compared to 2012. These decreases were partially offset by an increase in Loyalty
Edge revenue from additional client signings and a larger gain on the sale of investment securities in 2013.
Interest income increased $174 million or 2 percent in 2014 as compared to 2013, and $151 million or 2 percent in 2013 as compared to
2012. The increase in both years was primarily due to an increase in interest on loans driven by higher average Card Member loans, partially
offset by decreases in interest and dividends on investment securities driven by lower average investment securities.
Interest expense decreased $251 million or 13 percent in 2014 as compared to 2013, and $268 million or 12 percent in 2013 as compared
to 2012. The decrease in both years was primarily driven by a lower cost of funds on debt and customer deposits, partially offset by increases
in average customer deposit balances. The decrease in 2013 was also driven by lower average long-term debt balances.
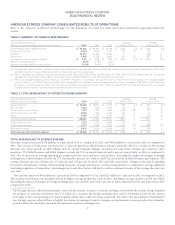
TABLE 4: PROVISIONS FOR LOSSES SUMMARY
Years Ended December 31,
(Millions, except percentages) 2014 2013 2012
Change
2014 vs. 2013
Change
2013 vs. 2012
Charge card $792$ 648 $ 601 $ 144 22 % $ 47 8 %
Card Member loans 1,138 1,115 1,030 23 2 85 8
Other 114 69 81 45 65 (12) (15)
Total provisions for losses $ 2,044 $ 1,832 $ 1,712 $ 212 12 % $ 120 7 %
PROVISIONS FOR LOSSES
Charge card provision for losses increased $144 million or 22 percent in 2014 as compared to 2013, and $47 million or 8 percent in 2013 as
compared to 2012. The increase in 2014 was primarily due to a slower reserve rate improvement in 2014 versus 2013, higher corporate card
write-offs and the effects of changes in other loss reserve assumptions resulting in a reserve build versus a reserve release in 2013. The 2013
increase was driven by higher average Card Member receivable balances resulting in higher net write-offs, partially offset by a higher reserve
release in 2013 than 2012.
Card Member loans provision for losses increased $23 million or 2 percent in 2014 as compared to 2013, and $85 million or 8 percent in
2013 as compared to 2012. The increase in 2014 was driven by higher average Card Member loans, a slower improvement in the reserve rate
and the effects of changes in other loss reserve assumptions resulting in a lower reserve release as compared to 2013, partially offset by the
benefit of lower net write-offs due to improved credit performance. The 2013 increase was primarily driven by lower reserve releases as
compared to 2012, partially offset by the benefit of lower net write-offs in 2013 due to improved credit performance.
Other provision for losses increased $45 million or 65 percent in 2014 as compared to 2013, and decreased $12 million or 15 percent in
2013 as compared to 2012. The increase in 2014 was due, in part, to a merchant-related charge in the fourth quarter of 2014.
23