American Express 2014 Annual Report Download - page 35
Download and view the complete annual report
Please find page 35 of the 2014 American Express annual report below. You can navigate through the pages in the report by either clicking on the pages listed below, or by using the keyword search tool below to find specific information within the annual report.-
 1
1 -
2
-
3
-
4
-
5
-
6
-
7
-
8
-
9
-
10
-
11
-
12
-
13
-
14
-
15
-
16
-
17
-
18
-
19
-
20
-
21
-
22
-
23
-
24
-
 25
25 -
 26
26 -
 27
27 -
 28
28 -
 29
29 -
 30
30 -
 31
31 -
 32
32 -
 33
33 -
 34
34 -
 35
35 -
 36
36 -
 37
37 -
 38
38 -
 39
39 -
 40
40 -
 41
41 -
 42
42 -
 43
43 -
 44
44 -
 45
45 -
46
-
47
-
48
-
49
-
50
-
51
-
52
-
53
-
54
-
55
-
56
-
57
-
58
-
59
-
60
-
61
-
62
-
63
-
64
-
65
-
66
-
67
-
68
-
69
-
70
-
71
-
72
-
73
-
74
-
75
-
76
-
77
-
78
-
79
-
80
-
81
-
82
-
83
-
84
-
85
-
86
-
87
-
88
-
89
-
90
-
91
-
92
-
93
-
94
-
95
-
96
-
97
-
98
-
99
-
100
-
101
-
102
-
103
-
104
-
105
-
106
-
107
-
108
-
109
-
110
-
111
-
112
-
113
-
114
-
115
-
116
-
117
-
118
-
119
-
120
-
121
-
122
-
123
-
124
-
125
-
126
-
127
-
128
-
129
-
130
 |
 |

AMERICAN EXPRESS COMPANY
2014 FINANCIAL REVIEW
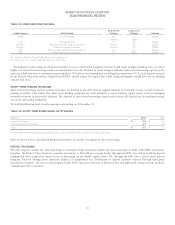
GLOBAL COMMERCIAL SERVICES SEGMENT
TABLE 14: GCS SELECTED INCOME STATEMENT DATA
Years Ended December 31,
(Millions, except percentages) 2014 2013 2012
Change
2014 vs. 2013
Change
2013 vs. 2012
Revenues
Discount revenue, net card fees and other $5,173$ 5,085 $ 4,995 $ 88 2 % $ 90 2 %
Interest income 15 13 11 2 15 2 18
Interest expense 240 245 257 (5) (2) (12) (5)
Net interest expense (225) (232) (246) (7) (3) (14) (6)
Total revenues net of interest expense 4,948 4,853 4,749 95 2 104 2
Provisions for losses 180 129 106 51 40 23 22
Total revenues net of interest expense after provisions for losses 4,768 4,724 4,643 44 1 81 2
Expenses
Marketing, promotion, rewards, Card Member services and other 682 604 579 78 13 25 4
Salaries and employee benefits and other operating expenses 1,678 2,876 3,104 (1,198) (42) (228) (7)
Total expenses 2,360 3,480 3,683 (1,120) (32) (203) (6)
Pretax segment income 2,408 1,244 960 1,164 94 284 30
Income tax provision 865 384 316 481 # 68 22
Segment income $1,543$860$644$683 79%$ 216 34%
Effective tax rate 35.9 % 30.9 % 32.9 %
# Denotes a variance greater than 100 percent
GCS offers global corporate payment services to large and mid-sized companies. Our business travel operations, which had been included in
GCS, were deconsolidated effective June 30, 2014 in connection with the business travel joint venture transaction, discussed previously;
therefore, there is a lack of comparability against periods prior to the deconsolidation. Our proportional share of the GBT JV’s net income is
now reported within other revenues.
TOTAL REVENUES NET OF INTEREST EXPENSE
Discount revenue, net card fees, and other revenues increased $88 million or 2 percent in 2014 as compared to 2013. The increase was
primarily due to the gain on the sale of our investment in Concur and higher discount revenue due to an increased level of Card Member
spending, partially offset by the impact of the business travel joint venture transaction, resulting in a lack of comparability between periods.
Billed business increased 6 percent in 2014 as compared to 2013, primarily driven by a 7 percent increase in average spending per proprietary
basic card. Billed business volume increased 8 percent within the U.S. and increased 3 percent outside the U.S. in 2014.
Net interest expense decreased $7 million or 3 percent in 2014 as compared to 2013, primarily driven by a lower cost of funds.
Total revenues net of interest expense increased $104 million or 2 percent in 2013 as compared to 2012, primarily due to higher discount
revenue from an increased level of Card Member spending.
PROVISIONS FOR LOSSES
Provisions for losses increased $51 million or 40 percent in 2014 as compared to 2013, primarily driven by a higher provision for charge
cards. The increase in charge card provisions was primarily due to higher average Card Member receivables resulting in higher corporate
card net write-offs. Provisions for losses increased $23 million or 22 percent in 2013 as compared to 2012, primarily driven by higher average
Card Member receivables resulting in higher net write-offs, partially offset by a lower reserve build compared to 2012. Refer to Table 15 for
the charge card net loss ratio as a percentage of charge volume.
EXPENSES
Marketing, promotion, rewards, Card Member services and other expenses increased $78 million or 13 percent in 2014 as compared to 2013,
primarily driven by higher Card Member rewards and marketing and promotion expenses. The increase in rewards costs was primarily
driven by higher spending volumes and includes the impact of a $13 million charge related to the Delta partnership renewal in the fourth
quarter of 2014. The increase in marketing and promotion expenses was driven by the reinvestment of a significant portion of the gains from
the business travel joint venture transaction and the sale of our investment in Concur in growth initiatives.
35