American Express 2014 Annual Report Download - page 26
Download and view the complete annual report
Please find page 26 of the 2014 American Express annual report below. You can navigate through the pages in the report by either clicking on the pages listed below, or by using the keyword search tool below to find specific information within the annual report.-
 1
1 -
2
-
3
-
4
-
5
-
6
-
7
-
8
-
9
-
10
-
11
-
12
-
13
-
14
-
15
-
 16
16 -
 17
17 -
 18
18 -
 19
19 -
 20
20 -
 21
21 -
 22
22 -
 23
23 -
 24
24 -
 25
25 -
 26
26 -
 27
27 -
 28
28 -
 29
29 -
 30
30 -
 31
31 -
 32
32 -
 33
33 -
 34
34 -
 35
35 -
 36
36 -
37
-
38
-
39
-
40
-
41
-
42
-
43
-
44
-
45
-
46
-
47
-
48
-
49
-
50
-
51
-
52
-
53
-
54
-
55
-
56
-
57
-
58
-
59
-
60
-
61
-
62
-
63
-
64
-
65
-
66
-
67
-
68
-
69
-
70
-
71
-
72
-
73
-
74
-
75
-
76
-
77
-
78
-
79
-
80
-
81
-
82
-
83
-
84
-
85
-
86
-
87
-
88
-
89
-
90
-
91
-
92
-
93
-
94
-
95
-
96
-
97
-
98
-
99
-
100
-
101
-
102
-
103
-
104
-
105
-
106
-
107
-
108
-
109
-
110
-
111
-
112
-
113
-
114
-
115
-
116
-
117
-
118
-
119
-
120
-
121
-
122
-
123
-
124
-
125
-
126
-
127
-
128
-
129
-
130
 |
 |

AMERICAN EXPRESS COMPANY
2014 FINANCIAL REVIEW
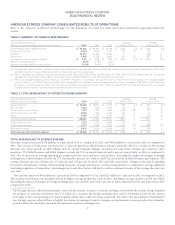
TABLE 7: SELECTED STATISTICAL INFORMATION
2014 2013
Percentage
Increase
(Decrease)
Percentage
Increase
(Decrease)
Assuming
No Changes in
Foreign Exchange
Rates(a)
Percentage
Increase
(Decrease)
Percentage
Increase
(Decrease)
Assuming
No Changes in
Foreign Exchange
Rates(a)
Worldwide(b)
Billed business 7% 9% 7% 8%
Proprietary billed business 7767
GNS billed business(c) 12 15 12 16
Airline-related volume
(9% of worldwide billed business for both 2014 and 2013) 5633
United States(b)
Billed business 88
Proprietary consumer card billed business(d) 77
Proprietary small business billed business(d) 10 11
Proprietary corporate services billed business(e) 88
T&E-related volume
(26% of U.S. billed business for both 2014 and 2013) 66
Non-T&E-related volume
(74% of U.S. billed business for both 2014 and 2013) 99
Airline-related volume
(8% of U.S. billed business for both 2014 and 2013) 34
Outside the United States(b)
Billed business 610 610
Japan, Asia Pacific & Australia (JAPA) billed business 10 14 613
Latin America & Canada (LACC) billed business (1) 8 611
Europe, the Middle East & Africa (EMEA) billed business 7776
Proprietary consumer and small business billed business(f) 2626
JAPA billed business —6(4) 6
LACC billed business (5) 2 47
EMEA billed business 9876
Proprietary corporate services billed business(e) 3% 6% 2% 3%
(a) The foreign currency adjusted information assumes a constant exchange rate between the periods being compared for purposes of currency translation into
U.S. dollars (i.e., assumes the foreign exchange rates used to determine results for the current year apply to the corresponding year-earlier period against which
such results are being compared). We believe the presentation of information on a foreign currency adjusted basis is helpful to investors by making it easier to
compare our performance in one period to that of another period without the variability caused by fluctuations in currency exchange rates.
(b) Captions in the table above not designated as “proprietary” or “GNS” include both proprietary and GNS data.
(c) Included in the GNMS segment.
(d) Included in the USCS segment.
(e) Included in the GCS segment.
(f) Included in the ICS segment.
26