American Express 2014 Annual Report Download - page 25
Download and view the complete annual report
Please find page 25 of the 2014 American Express annual report below. You can navigate through the pages in the report by either clicking on the pages listed below, or by using the keyword search tool below to find specific information within the annual report.-
 1
1 -
2
-
3
-
4
-
5
-
6
-
7
-
8
-
9
-
10
-
11
-
12
-
13
-
14
-
 15
15 -
 16
16 -
 17
17 -
 18
18 -
 19
19 -
 20
20 -
 21
21 -
 22
22 -
 23
23 -
 24
24 -
 25
25 -
 26
26 -
 27
27 -
 28
28 -
 29
29 -
 30
30 -
 31
31 -
 32
32 -
 33
33 -
 34
34 -
 35
35 -
36
-
37
-
38
-
39
-
40
-
41
-
42
-
43
-
44
-
45
-
46
-
47
-
48
-
49
-
50
-
51
-
52
-
53
-
54
-
55
-
56
-
57
-
58
-
59
-
60
-
61
-
62
-
63
-
64
-
65
-
66
-
67
-
68
-
69
-
70
-
71
-
72
-
73
-
74
-
75
-
76
-
77
-
78
-
79
-
80
-
81
-
82
-
83
-
84
-
85
-
86
-
87
-
88
-
89
-
90
-
91
-
92
-
93
-
94
-
95
-
96
-
97
-
98
-
99
-
100
-
101
-
102
-
103
-
104
-
105
-
106
-
107
-
108
-
109
-
110
-
111
-
112
-
113
-
114
-
115
-
116
-
117
-
118
-
119
-
120
-
121
-
122
-
123
-
124
-
125
-
126
-
127
-
128
-
129
-
130
 |
 |

AMERICAN EXPRESS COMPANY
2014 FINANCIAL REVIEW
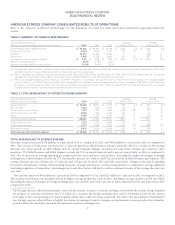
INCOME TAXES
The effective tax rate was 34.5 percent in 2014 compared to 32.1 percent in 2013 and 30.5 percent in 2012. The tax rates for 2014 and 2013
included expenses of $40 million and benefits of $150 million, respectively, related to the resolution of certain prior years’ items. The tax rate
for 2012 included benefits of $146 million related to the realization of certain foreign tax credits. The tax rates in all years reflect the level of
pretax income in relation to recurring permanent tax benefits and variances in the geographic mix of business.
TABLE 6: SELECTED STATISTICAL INFORMATION
Years Ended December 31, 2014 2013 2012
Change
2014 vs. 2013
Change
2013 vs. 2012
Card billed business: (billions)
United States $ 688.1 $ 637.0 $ 590.7 8% 8%
Outside the United States 334.7 315.4 297.7 6 6
Total $ 1,022.8 $ 952.4 $ 888.4 7 7
Total cards-in-force: (millions)
United States 54.9 53.1 52.0 3 2
Outside the United States 57.3 54.1 50.4 6 7
Total 112.2 107.2 102.4 5 5
Basic cards-in-force: (millions)
United States 42.6 41.1 40.3 4 2
Outside the United States 47.0 44.0 40.5 7 9
Total 89.6 85.1 80.8 5 5
Average discount rate 2.48% 2.51% 2.52%
Average basic Card Member spending (dollars)(a) $ 16,884 $ 16,334 $ 15,720 3 4
Average fee per card (dollars)(a) 40 40 39 — 3
Average fee per card adjusted (dollars)(a) $45$ 44 $ 43 2% 2%
(a) Average basic Card Member spending and average fee per card are computed from proprietary card activities only. Average fee per card is computed based on
net card fees, including the amortization of deferred direct acquisition costs divided by average worldwide proprietary cards-in-force. The adjusted average fee
per card, which is a non-GAAP measure, is computed in the same manner, but excludes amortization of deferred direct acquisition costs. The amount of
amortization excluded was $306 million, $262 million and $257 million for the years ended December 31, 2014, 2013 and 2012, respectively. We present
adjustedaveragefeepercardbecausewebelievethis metric presents a useful indicator of card fee pricing across a range of its proprietary card products.
25