American Express 2014 Annual Report Download - page 38
Download and view the complete annual report
Please find page 38 of the 2014 American Express annual report below. You can navigate through the pages in the report by either clicking on the pages listed below, or by using the keyword search tool below to find specific information within the annual report.-
 1
1 -
2
-
3
-
4
-
5
-
6
-
7
-
8
-
9
-
10
-
11
-
12
-
13
-
14
-
15
-
16
-
17
-
18
-
19
-
20
-
21
-
22
-
23
-
24
-
25
-
26
-
27
-
 28
28 -
 29
29 -
 30
30 -
 31
31 -
 32
32 -
 33
33 -
 34
34 -
 35
35 -
 36
36 -
 37
37 -
 38
38 -
 39
39 -
 40
40 -
 41
41 -
 42
42 -
 43
43 -
 44
44 -
 45
45 -
 46
46 -
 47
47 -
 48
48 -
49
-
50
-
51
-
52
-
53
-
54
-
55
-
56
-
57
-
58
-
59
-
60
-
61
-
62
-
63
-
64
-
65
-
66
-
67
-
68
-
69
-
70
-
71
-
72
-
73
-
74
-
75
-
76
-
77
-
78
-
79
-
80
-
81
-
82
-
83
-
84
-
85
-
86
-
87
-
88
-
89
-
90
-
91
-
92
-
93
-
94
-
95
-
96
-
97
-
98
-
99
-
100
-
101
-
102
-
103
-
104
-
105
-
106
-
107
-
108
-
109
-
110
-
111
-
112
-
113
-
114
-
115
-
116
-
117
-
118
-
119
-
120
-
121
-
122
-
123
-
124
-
125
-
126
-
127
-
128
-
129
-
130
 |
 |

AMERICAN EXPRESS COMPANY
2014 FINANCIAL REVIEW
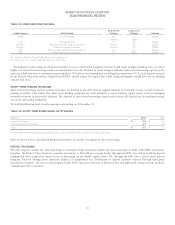
TABLE 17: GNMS SELECTED STATISTICAL INFORMATION
As of or for the Years Ended December 31,
(Millions, except percentages and where indicated) 2014 2013 2012
Change
2014 vs. 2013
Change
2013 vs. 2012
Global worldwide card billed business (billions) $ 1,022.8 $ 952.4 $ 888.4 7 % 7 %
Total segment assets (billions) $18.1$17.1$16.5 6 4
Segment capital $1,970$ 1,952 $ 2,048 1 (5)
Return on average segment capital(a) 84.0% 76.8% 68.6%
Return on average tangible segment capital(a) 92.9% 84.9% 75.9%
Global Network Services:
Card billed business (billions) $160.7$ 144.1 $ 128.8 12 12
Total cards-in-force 44.0 40.7 37.6 8 % 8 %
(a) Return on average segment capital is calculated by dividing (i) one-year period segment income ($1.7 billion, $1.6 billion and $1.4 billion for 2014, 2013 and
2012, respectively) by (ii) one-year average segment capital ($2.0 billion for 2014 and $2.1 billion for both 2013 and 2012). Return on average tangible segment
capital, a non-GAAP measure, is computed in the same manner as return on average segment capital except the computation of average tangible segment
capital, a non-GAAP measure, excludes from average segment capital average goodwill and other intangibles of $189 million, $195 million and $203 million as of
December 31, 2014, 2013 and 2012, respectively. We believe return on average tangible segment capital is a useful measure of the profitability of our business.
CORPORATE & OTHER
Corporate functions and certain other businesses, including our Enterprise Growth Group and other operations, are included in Corporate &
Other.
Corporate & Other net expense increased to $929 million in 2014, as compared to $900 million and $831 million in 2013 and 2012,
respectively. The increase in net expense in 2014 was due to higher restructuring charges, a charitable contribution to the American Express
Foundation combined with incremental investments in growth initiatives, partially offset by lower salary and benefits expense. The increase
in net after-tax expense for 2013 was primarily due to favorable effects in 2012 of revised estimates of the liability for uncashed Travelers
Cheques in certain international countries, as well as higher tax expenses in 2013, partially offset by the impact of restructuring costs in 2012.
Results for all periods disclosed also included net interest expense related to maintaining the liquidity pool discussed in “Consolidated
Capital Resources and Liquidity – Liquidity Management”, as well as interest expense related to other corporate indebtedness.
38