Humana 2012 Annual Report Download - page 116
Download and view the complete annual report
Please find page 116 of the 2012 Humana annual report below. You can navigate through the pages in the report by either clicking on the pages listed below, or by using the keyword search tool below to find specific information within the annual report.-
 1
1 -
2
-
3
-
4
-
5
-
6
-
7
-
8
-
9
-
10
-
11
-
12
-
13
-
14
-
15
-
16
-
17
-
18
-
19
-
20
-
21
-
22
-
23
-
24
-
25
-
26
-
27
-
28
-
29
-
30
-
31
-
32
-
33
-
34
-
35
-
36
-
37
-
38
-
39
-
40
-
41
-
42
-
43
-
44
-
45
-
46
-
47
-
48
-
49
-
50
-
51
-
52
-
53
-
54
-
55
-
56
-
57
-
58
-
59
-
60
-
61
-
62
-
63
-
64
-
65
-
66
-
67
-
68
-
69
-
70
-
71
-
72
-
73
-
74
-
75
-
76
-
77
-
78
-
79
-
80
-
81
-
82
-
83
-
84
-
85
-
86
-
87
-
88
-
89
-
90
-
91
-
92
-
93
-
94
-
95
-
96
-
97
-
98
-
99
-
100
-
101
-
102
-
103
-
104
-
105
-
 106
106 -
 107
107 -
 108
108 -
 109
109 -
 110
110 -
 111
111 -
 112
112 -
 113
113 -
 114
114 -
 115
115 -
 116
116 -
 117
117 -
 118
118 -
 119
119 -
 120
120 -
 121
121 -
 122
122 -
 123
123 -
 124
124 -
 125
125 -
 126
126 -
127
-
128
-
129
-
130
-
131
-
132
-
133
-
134
-
135
-
136
-
137
-
138
-
139
-
140
-
141
-
142
-
143
-
144
-
145
-
146
-
147
-
148
-
149
-
150
-
151
-
152
-
153
-
154
-
155
-
156
-
157
-
158
-
159
-
160
-
161
-
162
-
163
-
164
 |
 |

Humana Inc.
NOTES TO CONSOLIDATED FINANCIAL STATEMENTS—(Continued)
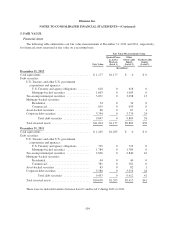
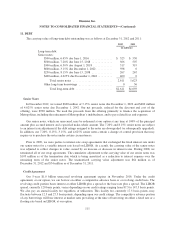
6. MEDICARE PART D
As discussed in Note 2, we cover prescription drug benefits in accordance with Medicare Part D under
multiple contracts with CMS. The consolidated balance sheets include the following amounts associated with
Medicare Part D as of December 31, 2012 and 2011:
2012 2011
Risk
Corridor
Settlement
CMS
Subsidies/
Discounts
Risk
Corridor
Settlement
CMS
Subsidies/
Discounts
(in millions)
Other current assets ..................................... $ 37 $635 $ 2 $363
Trade accounts payable and accrued expenses ................ (393) (77) (331) (139)
Net current (liability) asset ........................... $(356) $558 $(329) $224
At December 31, 2012, the net risk corridor payable balance included a payable of $158 million related to
the 2011 contract year that was paid in January 2013.
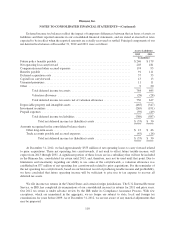
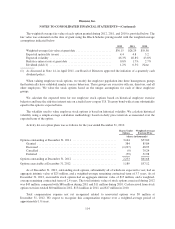
7. PROPERTY AND EQUIPMENT, NET
Property and equipment was comprised of the following at December 31, 2012 and 2011:
2012 2011
(in millions)
Land ............................................ $ 20 $ 18
Buildings and leasehold improvements ................. 620 523
Equipment ........................................ 728 606
Computer software ................................. 1,145 935
2,513 2,082
Accumulated depreciation ........................... (1,415) (1,170)
Property and equipment, net ...................... $1,098 $ 912
Depreciation expense was $263 million in 2012, $249 million in 2011, and $225 million in 2010, including
amortization expense for capitalized internally developed and purchased software of $151 million in 2012,
$139 million in 2011, and $136 million in 2010.
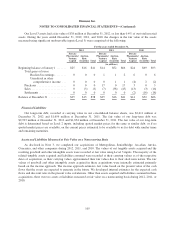
8. GOODWILL AND OTHER INTANGIBLE ASSETS
Changes in the carrying amount of goodwill for our reportable segments for the years ended December 31,
2012 and 2011 were as follows:
Retail
Employer
Group
Health &
Well-Being
Services
Other
Businesses Total
(in millions)
Balance at December 31, 2010 ..................... $593 $62 $1,856 $ 57 $2,568
Acquisitions ............................... 161 0 8 0 169
Subsequent payments/adjustments .............. 0 0 3 0 3
Balance at December 31, 2011 ..................... $754 $62 $1,867 $ 57 $2,740
Acquisitions ............................... 98 0 753 43 894
Subsequent payments/adjustments .............. (3) 9 0 0 6
Balance at December 31, 2012 ..................... $849 $71 $2,620 $100 $3,640
106