Humana 2012 Annual Report Download - page 92
Download and view the complete annual report
Please find page 92 of the 2012 Humana annual report below. You can navigate through the pages in the report by either clicking on the pages listed below, or by using the keyword search tool below to find specific information within the annual report.-
 1
1 -
2
-
3
-
4
-
5
-
6
-
7
-
8
-
9
-
10
-
11
-
12
-
13
-
14
-
15
-
16
-
17
-
18
-
19
-
20
-
21
-
22
-
23
-
24
-
25
-
26
-
27
-
28
-
29
-
30
-
31
-
32
-
33
-
34
-
35
-
36
-
37
-
38
-
39
-
40
-
41
-
42
-
43
-
44
-
45
-
46
-
47
-
48
-
49
-
50
-
51
-
52
-
53
-
54
-
55
-
56
-
57
-
58
-
59
-
60
-
61
-
62
-
63
-
64
-
65
-
66
-
67
-
68
-
69
-
70
-
71
-
72
-
73
-
74
-
75
-
76
-
77
-
78
-
79
-
80
-
81
-
 82
82 -
 83
83 -
 84
84 -
 85
85 -
 86
86 -
 87
87 -
 88
88 -
 89
89 -
 90
90 -
 91
91 -
 92
92 -
 93
93 -
 94
94 -
 95
95 -
 96
96 -
 97
97 -
 98
98 -
 99
99 -
 100
100 -
 101
101 -
 102
102 -
103
-
104
-
105
-
106
-
107
-
108
-
109
-
110
-
111
-
112
-
113
-
114
-
115
-
116
-
117
-
118
-
119
-
120
-
121
-
122
-
123
-
124
-
125
-
126
-
127
-
128
-
129
-
130
-
131
-
132
-
133
-
134
-
135
-
136
-
137
-
138
-
139
-
140
-
141
-
142
-
143
-
144
-
145
-
146
-
147
-
148
-
149
-
150
-
151
-
152
-
153
-
154
-
155
-
156
-
157
-
158
-
159
-
160
-
161
-
162
-
163
-
164
 |
 |
have the intent to sell the debt security or it is more likely than not we will be required to sell the debt security
before recovery of our amortized cost basis. However, if we do not intend to sell the debt security, we evaluate
the expected cash flows to be received as compared to amortized cost and determine if a credit loss has occurred.
In the event of a credit loss, only the amount of the impairment associated with the credit loss is recognized
currently in income with the remainder of the loss recognized in other comprehensive income.
When we do not intend to sell a security in an unrealized loss position, potential other-than-temporary
impairment is considered using a variety of factors, including the length of time and extent to which the fair
value has been less than cost; adverse conditions specifically related to the industry, geographic area or financial
condition of the issuer or underlying collateral of a security; payment structure of the security; changes in credit
rating of the security by the rating agencies; the volatility of the fair value changes; and changes in fair value of
the security after the balance sheet date. For debt securities, we take into account expectations of relevant market
and economic data. For example, with respect to mortgage and asset-backed securities, such data includes
underlying loan level data and structural features such as seniority and other forms of credit enhancements. A
decline in fair value is considered other-than-temporary when we do not expect to recover the entire amortized
cost basis of the security. We estimate the amount of the credit loss component of a debt security as the
difference between the amortized cost and the present value of the expected cash flows of the security. The
present value is determined using the best estimate of future cash flows discounted at the implicit interest rate at
the date of purchase. The risks inherent in assessing the impairment of an investment include the risk that market
factors may differ from our expectations, facts and circumstances factored into our assessment may change with
the passage of time, or we may decide to subsequently sell the investment. The determination of whether a
decline in the value of an investment is other than temporary requires us to exercise significant diligence and
judgment. The discovery of new information and the passage of time can significantly change these judgments.
The status of the general economic environment and significant changes in the national securities markets
influence the determination of fair value and the assessment of investment impairment. There is a continuing risk
that declines in fair value may occur and additional material realized losses from sales or other-than-temporary
impairments may be recorded in future periods.
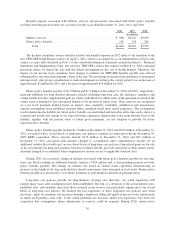
The recoverability of our non-agency residential and commercial mortgage-backed securities is supported
by factors such as seniority, underlying collateral characteristics and credit enhancements. These residential and
commercial mortgage-backed securities at December 31, 2012 primarily were composed of senior tranches
having high credit support, with over 99% of the collateral consisting of prime loans. The weighted average
credit rating of all commercial mortgage-backed securities was AA+ at December 31, 2012.
Several European countries, including Spain, Italy, Ireland, Portugal, and Greece, have been subject to
credit deterioration due to weakness in their economic and fiscal situations. We have no direct exposure to
sovereign issuances of these five countries.
All issuers of securities we own that were trading at an unrealized loss at December 31, 2012 remain current
on all contractual payments. After taking into account these and other factors previously described, we believe
these unrealized losses primarily were caused by an increase in market interest rates and tighter liquidity
conditions in the current markets than when the securities were purchased. At December 31, 2012, we did not
intend to sell the securities with an unrealized loss position in accumulated other comprehensive income, and it is
not likely that we will be required to sell these securities before recovery of their amortized cost basis. As a
result, we believe that the securities with an unrealized loss were not other-than-temporarily impaired at
December 31, 2012.
There were no material other-than-temporary impairments in 2012, 2011, or 2010.
Goodwill and Long-lived Assets
At December 31, 2012, goodwill and other long-lived assets represented 28% of total assets and 62% of
total stockholders’ equity, compared to 23% and 51%, respectively, at December 31, 2011.
82