Humana 2012 Annual Report Download - page 94
Download and view the complete annual report
Please find page 94 of the 2012 Humana annual report below. You can navigate through the pages in the report by either clicking on the pages listed below, or by using the keyword search tool below to find specific information within the annual report.-
 1
1 -
2
-
3
-
4
-
5
-
6
-
7
-
8
-
9
-
10
-
11
-
12
-
13
-
14
-
15
-
16
-
17
-
18
-
19
-
20
-
21
-
22
-
23
-
24
-
25
-
26
-
27
-
28
-
29
-
30
-
31
-
32
-
33
-
34
-
35
-
36
-
37
-
38
-
39
-
40
-
41
-
42
-
43
-
44
-
45
-
46
-
47
-
48
-
49
-
50
-
51
-
52
-
53
-
54
-
55
-
56
-
57
-
58
-
59
-
60
-
61
-
62
-
63
-
64
-
65
-
66
-
67
-
68
-
69
-
70
-
71
-
72
-
73
-
74
-
75
-
76
-
77
-
78
-
79
-
80
-
81
-
82
-
83
-
 84
84 -
 85
85 -
 86
86 -
 87
87 -
 88
88 -
 89
89 -
 90
90 -
 91
91 -
 92
92 -
 93
93 -
 94
94 -
 95
95 -
 96
96 -
 97
97 -
 98
98 -
 99
99 -
 100
100 -
 101
101 -
 102
102 -
 103
103 -
 104
104 -
105
-
106
-
107
-
108
-
109
-
110
-
111
-
112
-
113
-
114
-
115
-
116
-
117
-
118
-
119
-
120
-
121
-
122
-
123
-
124
-
125
-
126
-
127
-
128
-
129
-
130
-
131
-
132
-
133
-
134
-
135
-
136
-
137
-
138
-
139
-
140
-
141
-
142
-
143
-
144
-
145
-
146
-
147
-
148
-
149
-
150
-
151
-
152
-
153
-
154
-
155
-
156
-
157
-
158
-
159
-
160
-
161
-
162
-
163
-
164
 |
 |

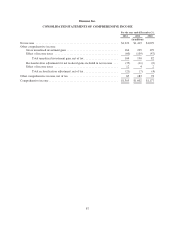
Interest rate risk also represents a market risk factor affecting our consolidated financial position due to our
significant investment portfolio, consisting primarily of fixed maturity securities of investment-grade quality
with a weighted average S&P credit rating of AA- at December 31, 2012. Our net unrealized position improved
$203 million from a net unrealized gain position of $525 million at December 31, 2011 to a net unrealized gain
position of $728 million at December 31, 2012. At December 31, 2012, we had gross unrealized losses of $8
million on our investment portfolio primarily due to an increase in market interest rates and tighter liquidity
conditions in the current markets than when the securities were purchased, and as such, there were no material
other-than-temporary impairments during 2012. While we believe that these impairments are temporary and we
currently do not have the intent to sell such securities, given the current market conditions and the significant
judgments involved, there is a continuing risk that future declines in fair value may occur and material realized
losses from sales or other-than-temporary impairments may be recorded in future periods.
Duration is the time-weighted average of the present value of the bond portfolio’s cash flow. Duration is
indicative of the relationship between changes in fair value and changes in interest rates, providing a general
indication of the sensitivity of the fair values of our fixed maturity securities to changes in interest rates.
However, actual fair values may differ significantly from estimates based on duration. The average duration of
our investment portfolio, including cash and cash equivalents, was approximately 4.0 years as of December 31,
2012 and 3.9 years as of December 31, 2011. Based on the duration including cash equivalents, a 1% increase in
interest rates would generally decrease the fair value of our securities by approximately $443 million.
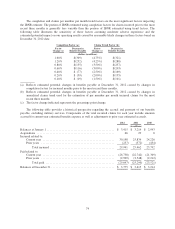
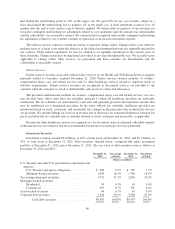
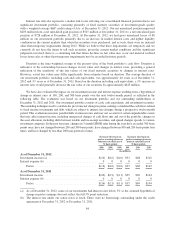
We have also evaluated the impact on our investment income and interest expense resulting from a hypothetical
change in interest rates of 100, 200, and 300 basis points over the next twelve-month period, as reflected in the
following table. The evaluation was based on our investment portfolio and our outstanding indebtedness at
December 31, 2012 and 2011. Our investment portfolio consists of cash, cash equivalents, and investment securities.
The modeling technique used to calculate the pro forma net change in pretax earnings considered the cash flows related
to fixed income investments and debt, which are subject to interest rate changes during a prospective twelve-month
period. This evaluation measures parallel shifts in interest rates and may not account for certain unpredictable events
that may affect interest income, including unexpected changes of cash flows into and out of the portfolio, changes in
the asset allocation, including shifts between taxable and tax-exempt securities, and spread changes specific to various
investment categories. In the past ten years, changes in 3 month LIBOR rates during the year have exceeded 300 basis
points once, have not changed between 200 and 300 basis points, have changed between 100 and 200 basis points four
times, and have changed by less than 100 basis points five times.
Increase (decrease) in
pretax earnings given an
interest rate decrease of
X basis points
Increase (decrease) in
pretax earnings given an
interest rate increase of
X basis points
(300) (200) (100) 100 200 300
(in millions)
As of December 31, 2012
Investment income (a) ................................ $(16) $(16) $(10) $33 $68 $102
Interest expense (b) ................................... 0 0 0 0 0 0
Pretax ......................................... $(16) $(16) $(10) $33 $68 $102
As of December 31, 2011
Investment income ................................... $(26) $(21) $(11) $35 $69 $104
Interest expense (b) ................................... 0 0 0 0 0 0
Pretax ......................................... $(26) $(21) $(11) $35 $69 $104
(a) As of December 31, 2012, some of our investments had interest rates below 3% so the assumed hypothetical
change in pretax earnings does not reflect the full 3% point reduction.
(b) The interest rate under our senior notes is fixed. There were no borrowings outstanding under the credit
agreement at December 31, 2012 or December 31, 2011.
84