Humana 2012 Annual Report Download - page 133
Download and view the complete annual report
Please find page 133 of the 2012 Humana annual report below. You can navigate through the pages in the report by either clicking on the pages listed below, or by using the keyword search tool below to find specific information within the annual report.-
 1
1 -
2
-
3
-
4
-
5
-
6
-
7
-
8
-
9
-
10
-
11
-
12
-
13
-
14
-
15
-
16
-
17
-
18
-
19
-
20
-
21
-
22
-
23
-
24
-
25
-
26
-
27
-
28
-
29
-
30
-
31
-
32
-
33
-
34
-
35
-
36
-
37
-
38
-
39
-
40
-
41
-
42
-
43
-
44
-
45
-
46
-
47
-
48
-
49
-
50
-
51
-
52
-
53
-
54
-
55
-
56
-
57
-
58
-
59
-
60
-
61
-
62
-
63
-
64
-
65
-
66
-
67
-
68
-
69
-
70
-
71
-
72
-
73
-
74
-
75
-
76
-
77
-
78
-
79
-
80
-
81
-
82
-
83
-
84
-
85
-
86
-
87
-
88
-
89
-
90
-
91
-
92
-
93
-
94
-
95
-
96
-
97
-
98
-
99
-
100
-
101
-
102
-
103
-
104
-
105
-
106
-
107
-
108
-
109
-
110
-
111
-
112
-
113
-
114
-
115
-
116
-
117
-
118
-
119
-
120
-
121
-
122
-
 123
123 -
 124
124 -
 125
125 -
 126
126 -
 127
127 -
 128
128 -
 129
129 -
 130
130 -
 131
131 -
 132
132 -
 133
133 -
 134
134 -
 135
135 -
 136
136 -
 137
137 -
 138
138 -
 139
139 -
 140
140 -
 141
141 -
 142
142 -
 143
143 -
144
-
145
-
146
-
147
-
148
-
149
-
150
-
151
-
152
-
153
-
154
-
155
-
156
-
157
-
158
-
159
-
160
-
161
-
162
-
163
-
164
 |
 |

Humana Inc.
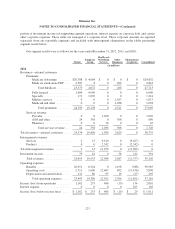
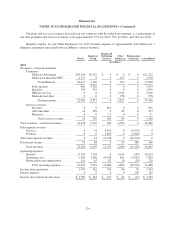
NOTES TO CONSOLIDATED FINANCIAL STATEMENTS—(Continued)
portion of investment income not supporting segment operations, interest expense on corporate debt, and certain
other corporate expenses. These items are managed at a corporate level. These corporate amounts are reported
separately from our reportable segments and included with intersegment eliminations in the tables presenting
segment results below.
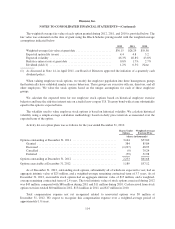
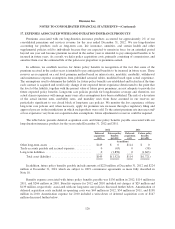
Our segment results were as follows for the years ended December 31, 2012, 2011, and 2010:
Retail
Employer
Group
Health and
Well-Being
Services
Other
Businesses
Eliminations/
Corporate Consolidated
(in millions)
2012
Revenues—external customers
Premiums:
Medicare Advantage ........ $20,788 $ 4,064 $ 0 $ 0 $ 0 $24,852
Medicare stand-alone PDP .... 2,587 8 0 266 0 2,861
Total Medicare ......... 23,375 4,072 0 266 0 27,713
Fully-insured .............. 1,004 4,996 0 0 0 6,000
Specialty .................. 171 1,070 0 0 0 1,241
Military services ........... 0 0 0 1,017 0 1,017
Medicaid and other ......... 0 0 0 1,038 0 1,038
Total premiums ........ 24,550 10,138 0 2,321 0 37,009
Services revenue:
Provider .................. 0 0 1,020 0 0 1,020
ASO and other ............. 24 358 0 308 0 690
Pharmacy ................. 0 0 16 0 0 16
Total services revenue . . . 24 358 1,036 308 0 1,726
Total revenues—external customers .... 24,574 10,496 1,036 2,629 0 38,735
Intersegment revenues
Services ...................... 2 15 9,610 0 (9,627) 0
Products ...................... 0 0 2,342 0 (2,342) 0
Total intersegment revenues .......... 2 15 11,952 0 (11,969) 0
Investment income .................. 79 42 0 58 212 391
Total revenues ................. 24,655 10,553 12,988 2,687 (11,757) 39,126
Operating expenses:
Benefits ...................... 20,651 8,524 0 2,198 (388) 30,985
Operating costs ................ 2,711 1,696 12,407 492 (11,476) 5,830
Depreciation and amortization ..... 131 80 95 16 (27) 295
Total operating expenses ..... 23,493 10,300 12,502 2,706 (11,891) 37,110
Income (loss) from operations ......... 1,162 253 486 (19) 134 2,016
Interest expense .................... 0 0 0 0 105 105
Income (loss) before income taxes ..... $ 1,162 $ 253 $ 486 $ (19) $ 29 $ 1,911
123