Humana 2012 Annual Report Download - page 52
Download and view the complete annual report
Please find page 52 of the 2012 Humana annual report below. You can navigate through the pages in the report by either clicking on the pages listed below, or by using the keyword search tool below to find specific information within the annual report.-
 1
1 -
2
-
3
-
4
-
5
-
6
-
7
-
8
-
9
-
10
-
11
-
12
-
13
-
14
-
15
-
16
-
17
-
18
-
19
-
20
-
21
-
22
-
23
-
24
-
25
-
26
-
27
-
28
-
29
-
30
-
31
-
32
-
33
-
34
-
35
-
36
-
37
-
38
-
39
-
40
-
41
-
 42
42 -
 43
43 -
 44
44 -
 45
45 -
 46
46 -
 47
47 -
 48
48 -
 49
49 -
 50
50 -
 51
51 -
 52
52 -
 53
53 -
 54
54 -
 55
55 -
 56
56 -
 57
57 -
 58
58 -
 59
59 -
 60
60 -
 61
61 -
 62
62 -
63
-
64
-
65
-
66
-
67
-
68
-
69
-
70
-
71
-
72
-
73
-
74
-
75
-
76
-
77
-
78
-
79
-
80
-
81
-
82
-
83
-
84
-
85
-
86
-
87
-
88
-
89
-
90
-
91
-
92
-
93
-
94
-
95
-
96
-
97
-
98
-
99
-
100
-
101
-
102
-
103
-
104
-
105
-
106
-
107
-
108
-
109
-
110
-
111
-
112
-
113
-
114
-
115
-
116
-
117
-
118
-
119
-
120
-
121
-
122
-
123
-
124
-
125
-
126
-
127
-
128
-
129
-
130
-
131
-
132
-
133
-
134
-
135
-
136
-
137
-
138
-
139
-
140
-
141
-
142
-
143
-
144
-
145
-
146
-
147
-
148
-
149
-
150
-
151
-
152
-
153
-
154
-
155
-
156
-
157
-
158
-
159
-
160
-
161
-
162
-
163
-
164
 |
 |
Seasonality
One of the product offerings of our Retail segment is Medicare stand-alone prescription drug plans, or
PDPs, under the Medicare Part D program. These plans provide varying degrees of coverage. Our quarterly
Retail segment earnings and operating cash flows are impacted by the Medicare Part D benefit design and
changes in the composition of our membership. The Medicare Part D benefit design results in coverage that
varies as a member’s cumulative out-of-pocket costs pass through successive stages of a member’s plan period
which begins annually on January 1 for renewals. These plan designs generally result in us sharing a greater
portion of the responsibility for total prescription drug costs in the early stages and less in the latter stages. As a
result, the PDP benefit ratio generally decreases as the year progresses. In addition, the number of low-income
senior members as well as year-over-year changes in the mix of membership in our stand-alone PDP products
affects the quarterly benefit ratio pattern.
Our Employer Group segment also experiences seasonality in the benefit ratio pattern. However, the effect
is opposite of the Retail segment, with the Employer Group’s benefit ratio increasing as fully-insured members
progress through their annual deductible and maximum out-of-pocket expenses.
2012 Highlights
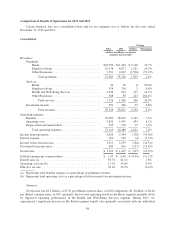
Consolidated
• Our 2012 results reflect the continued implementation of our strategy to offer our members affordable
health care combined with a positive consumer experience in growing markets. At the core of this
strategy is our integrated care delivery model, which unites quality care, high member engagement, and
sophisticated data analytics. Our approach to primary, physician-directed care for our members aims to
provide quality care that is consistent, integrated, cost-effective, and member-focused. The model is
designed to improve health outcomes and affordability for individuals and for the health system as a
whole, while offering our members a simple, seamless healthcare experience. We believe this strategy
is positioning us for continued sustainable growth in both membership and earnings. At December 31,
2012, approximately 511,700 members, or 26.5%, of our individual Medicare Advantage membership
were in risk arrangements under our integrated care delivery model. We expect that number to grow in
2013.
• During 2012, we issued $1 billion of senior notes, repurchased 6.25 million shares in open market
transactions for $460 million, and declared dividends to stockholders of $1.03 per share for an
aggregate amount of $166 million.
• Our results for the year ended December 31, 2012, were significantly impacted by a higher benefit
ratio. The consolidated benefit ratio increased 160 basis points to 83.7% for the year ended
December 31, 2012 compared to 82.1% for the year ended December 31, 2011. The increase primarily
was due to an increase in the Retail segment benefit ratio primarily associated with our individual
Medicare Advantage products discussed in our Retail segment highlights that follow.
• Comparisons to our 2012 consolidated benefit ratio and operating cost ratio are impacted by the
transition to the new TRICARE South Region contract on April 1, 2012, which is accounted for similar
to an administrative services fee only agreement as described in our Other Businesses highlights that
follow. Our previous contract was accounted for similar to our fully-insured products.
• As more fully described herein under the section titled “Benefits Expense Recognition” actuarial
standards require the use of assumptions based on moderately adverse experience, which generally
results in favorable reserve development, or reserves that are considered redundant. We experienced
favorable medical claims reserve development related to prior fiscal years of $257 million in 2012,
$372 million in 2011, and $434 million in 2010. Year-over-year comparisons of the benefit ratio were
negatively impacted by the $115 million decline in favorable prior-period medical claims reserve
development from 2011 to 2012.
42