Humana 2012 Annual Report Download - page 66
Download and view the complete annual report
Please find page 66 of the 2012 Humana annual report below. You can navigate through the pages in the report by either clicking on the pages listed below, or by using the keyword search tool below to find specific information within the annual report.-
 1
1 -
2
-
3
-
4
-
5
-
6
-
7
-
8
-
9
-
10
-
11
-
12
-
13
-
14
-
15
-
16
-
17
-
18
-
19
-
20
-
21
-
22
-
23
-
24
-
25
-
26
-
27
-
28
-
29
-
30
-
31
-
32
-
33
-
34
-
35
-
36
-
37
-
38
-
39
-
40
-
41
-
42
-
43
-
44
-
45
-
46
-
47
-
48
-
49
-
50
-
51
-
52
-
53
-
54
-
55
-
 56
56 -
 57
57 -
 58
58 -
 59
59 -
 60
60 -
 61
61 -
 62
62 -
 63
63 -
 64
64 -
 65
65 -
 66
66 -
 67
67 -
 68
68 -
 69
69 -
 70
70 -
 71
71 -
 72
72 -
 73
73 -
 74
74 -
 75
75 -
 76
76 -
77
-
78
-
79
-
80
-
81
-
82
-
83
-
84
-
85
-
86
-
87
-
88
-
89
-
90
-
91
-
92
-
93
-
94
-
95
-
96
-
97
-
98
-
99
-
100
-
101
-
102
-
103
-
104
-
105
-
106
-
107
-
108
-
109
-
110
-
111
-
112
-
113
-
114
-
115
-
116
-
117
-
118
-
119
-
120
-
121
-
122
-
123
-
124
-
125
-
126
-
127
-
128
-
129
-
130
-
131
-
132
-
133
-
134
-
135
-
136
-
137
-
138
-
139
-
140
-
141
-
142
-
143
-
144
-
145
-
146
-
147
-
148
-
149
-
150
-
151
-
152
-
153
-
154
-
155
-
156
-
157
-
158
-
159
-
160
-
161
-
162
-
163
-
164
 |
 |

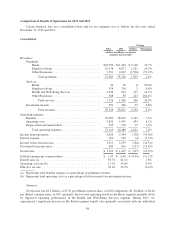
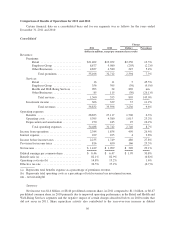
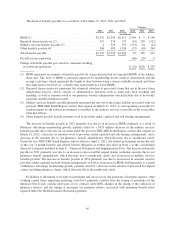
Comparison of Results of Operations for 2011 and 2010
Certain financial data on a consolidated basis and for our segments was as follows for the years ended
December 31, 2011 and 2010:
Consolidated
Change
2011 2010 Dollars Percentage
(dollars in millions, except per common share results)
Revenues:
Premiums:
Retail ............................ $21,402 $19,052 $2,350 12.3%
Employer Group ................... 8,877 9,080 (203) (2.2)%
Other Businesses ................... 4,827 4,580 247 5.4%
Total premiums ................ 35,106 32,712 2,394 7.3%
Services:
Retail ............................ 16 11 5 45.5%
Employer Group ................... 356 395 (39) (9.9)%
Health and Well-Being Services ....... 903 34 869 nm
Other Businesses ................... 85 115 (30) (26.1)%
Total services .................. 1,360 555 805 145.0%
Investment income ...................... 366 329 37 11.2%
Total revenues ................. 36,832 33,596 3,236 9.6%
Operating expenses:
Benefits .............................. 28,823 27,117 1,706 6.3%
Operating costs ........................ 5,395 4,380 1,015 23.2%
Depreciation and amortization ............. 270 245 25 10.2%
Total operating expenses ............. 34,488 31,742 2,746 8.7%
Income from operations ...................... 2,344 1,854 490 26.4%
Interest expense ............................ 109 105 4 3.8%
Income before income taxes .................. 2,235 1,749 486 27.8%
Provision for income taxes ................... 816 650 166 25.5%
Net income ................................ $ 1,419 $ 1,099 $ 320 29.1%
Diluted earnings per common share ............ $ 8.46 $ 6.47 $ 1.99 30.8%
Benefit ratio (a) ............................ 82.1% 82.9% (0.8)%
Operating cost ratio (b) ...................... 14.8% 13.2% 1.6%
Effective tax rate ........................... 36.5% 37.2% (0.7)%
(a) Represents total benefits expense as a percentage of premiums revenue.
(b) Represents total operating costs as a percentage of total revenues less investment income.
nm – not meaningful
Summary
Net income was $1.4 billion, or $8.46 per diluted common share, in 2011 compared to $1.1 billion, or $6.47
per diluted common share, in 2010 primarily due to improved operating performance in the Retail and Health and
Well-Being Services segments and the negative impact of certain charges described below on 2010 results that
did not recur in 2011. Share repurchase activity also contributed to the year-over-year increase in diluted
56