Humana 2012 Annual Report Download - page 62
Download and view the complete annual report
Please find page 62 of the 2012 Humana annual report below. You can navigate through the pages in the report by either clicking on the pages listed below, or by using the keyword search tool below to find specific information within the annual report.-
 1
1 -
2
-
3
-
4
-
5
-
6
-
7
-
8
-
9
-
10
-
11
-
12
-
13
-
14
-
15
-
16
-
17
-
18
-
19
-
20
-
21
-
22
-
23
-
24
-
25
-
26
-
27
-
28
-
29
-
30
-
31
-
32
-
33
-
34
-
35
-
36
-
37
-
38
-
39
-
40
-
41
-
42
-
43
-
44
-
45
-
46
-
47
-
48
-
49
-
50
-
51
-
 52
52 -
 53
53 -
 54
54 -
 55
55 -
 56
56 -
 57
57 -
 58
58 -
 59
59 -
 60
60 -
 61
61 -
 62
62 -
 63
63 -
 64
64 -
 65
65 -
 66
66 -
 67
67 -
 68
68 -
 69
69 -
 70
70 -
 71
71 -
 72
72 -
73
-
74
-
75
-
76
-
77
-
78
-
79
-
80
-
81
-
82
-
83
-
84
-
85
-
86
-
87
-
88
-
89
-
90
-
91
-
92
-
93
-
94
-
95
-
96
-
97
-
98
-
99
-
100
-
101
-
102
-
103
-
104
-
105
-
106
-
107
-
108
-
109
-
110
-
111
-
112
-
113
-
114
-
115
-
116
-
117
-
118
-
119
-
120
-
121
-
122
-
123
-
124
-
125
-
126
-
127
-
128
-
129
-
130
-
131
-
132
-
133
-
134
-
135
-
136
-
137
-
138
-
139
-
140
-
141
-
142
-
143
-
144
-
145
-
146
-
147
-
148
-
149
-
150
-
151
-
152
-
153
-
154
-
155
-
156
-
157
-
158
-
159
-
160
-
161
-
162
-
163
-
164
 |
 |

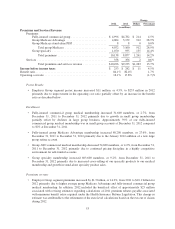
acquired in connection with the Arcadian acquisition effective March 31, 2012. Individual Medicare
stand-alone PDP premiums revenue increased $270 million, or 11.7%, in 2012 compared to 2011
primarily due to a 20.0% increase in average individual PDP membership, partially offset by a decrease
in individual Medicare stand-alone PDP per member premiums. This was primarily a result of sales of
our Humana-Walmart plan that we began offering for the 2011 plan year.
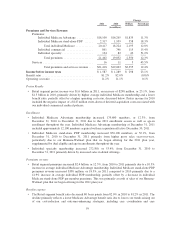
Benefits expense
• The Retail segment benefit ratio increased 290 basis points from 81.2% in 2011 to 84.1% in 2012.
During 2012, we experienced a significant increase in the benefit ratio for our individual Medicare
Advantage products primarily due to a planned increase in the target benefit ratio associated with
positioning for Health Insurance Reform Legislation funding changes and minimum benefit ratio
requirements, a higher benefit ratio experienced on new membership than the assumptions used in our
2012 Medicare bids, and increased outpatient utilization for both new and existing members. In
addition, year-over-year comparisons of the benefit ratio were negatively impacted by lower favorable
prior-period medical claims reserve development in 2012 than in 2011 and a year-over-year increase in
clinicians and other health care quality expenditures given our continuing growth in membership. The
Retail segment’s pretax income for 2012 included the beneficial effect of $192 million in favorable
prior-period medical claims reserve development versus $245 million in 2011. This favorable prior-
period medical claims reserve development decreased the Retail segment benefit ratio by
approximately 80 basis points in 2012 versus approximately 110 basis points in 2011.
Operating costs
• The Retail segment operating cost ratio of 11.0% for 2012 decreased 20 basis points from 11.2% for
2011 primarily due to scale efficiencies associated with servicing higher year-over-year membership
together with our continued focus on operating cost efficiencies, partially offset by higher year-over-
year clinical, provider, and technological infrastructure spending.
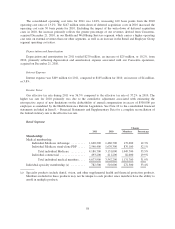
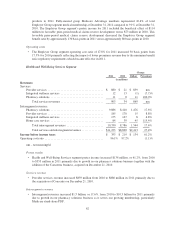
Employer Group Segment
Change
2012 2011 Members Percentage
Membership:
Medical membership:
Fully-insured commercial group ....................... 1,211,800 1,180,200 31,600 2.7%
ASO............................................. 1,237,700 1,292,300 (54,600) (4.2)%
Group Medicare Advantage .......................... 370,800 290,600 80,200 27.6%
Medicare Advantage ASO ........................... 27,700 27,600 100 0.4%
Total group Medicare Advantage .................. 398,500 318,200 80,300 25.2%
Group Medicare stand-alone PDP ...................... 4,400 4,200 200 4.8%
Total group Medicare ........................... 402,900 322,400 80,500 25.0%
Total group medical members ..................... 2,852,400 2,794,900 57,500 2.1%
Group specialty membership (a) ........................... 7,136,200 6,532,600 603,600 9.2%
(a) Specialty products include dental, vision, and other supplemental health and financial protection products.
Members included in these products may not be unique to each product since members have the ability to
enroll in multiple products.
52