Humana 2012 Annual Report Download - page 72
Download and view the complete annual report
Please find page 72 of the 2012 Humana annual report below. You can navigate through the pages in the report by either clicking on the pages listed below, or by using the keyword search tool below to find specific information within the annual report.-
 1
1 -
2
-
3
-
4
-
5
-
6
-
7
-
8
-
9
-
10
-
11
-
12
-
13
-
14
-
15
-
16
-
17
-
18
-
19
-
20
-
21
-
22
-
23
-
24
-
25
-
26
-
27
-
28
-
29
-
30
-
31
-
32
-
33
-
34
-
35
-
36
-
37
-
38
-
39
-
40
-
41
-
42
-
43
-
44
-
45
-
46
-
47
-
48
-
49
-
50
-
51
-
52
-
53
-
54
-
55
-
56
-
57
-
58
-
59
-
60
-
61
-
 62
62 -
 63
63 -
 64
64 -
 65
65 -
 66
66 -
 67
67 -
 68
68 -
 69
69 -
 70
70 -
 71
71 -
 72
72 -
 73
73 -
 74
74 -
 75
75 -
 76
76 -
 77
77 -
 78
78 -
 79
79 -
 80
80 -
 81
81 -
 82
82 -
83
-
84
-
85
-
86
-
87
-
88
-
89
-
90
-
91
-
92
-
93
-
94
-
95
-
96
-
97
-
98
-
99
-
100
-
101
-
102
-
103
-
104
-
105
-
106
-
107
-
108
-
109
-
110
-
111
-
112
-
113
-
114
-
115
-
116
-
117
-
118
-
119
-
120
-
121
-
122
-
123
-
124
-
125
-
126
-
127
-
128
-
129
-
130
-
131
-
132
-
133
-
134
-
135
-
136
-
137
-
138
-
139
-
140
-
141
-
142
-
143
-
144
-
145
-
146
-
147
-
148
-
149
-
150
-
151
-
152
-
153
-
154
-
155
-
156
-
157
-
158
-
159
-
160
-
161
-
162
-
163
-
164
 |
 |

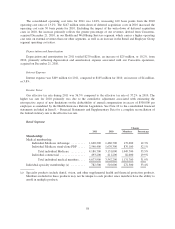
products in 2011. Fully-insured group Medicare Advantage members represented 10.4% of total
Employer Group segment medical membership at December 31, 2011 compared to 9.1% at December 31,
2010. The Employer Group segment’s pretax income for 2011 included the beneficial effect of $114
million in favorable prior-period medical claims reserve development versus $73 million in 2010. This
favorable prior-period medical claims reserve development decreased the Employer Group segment
benefit ratio by approximately 130 basis points in 2011 versus approximately 80 basis points in 2010.
Operating costs
• The Employer Group segment operating cost ratio of 17.8% for 2011 increased 30 basis points from
17.5% for 2010 primarily reflecting the impact of lower premiums revenue due to the minimum benefit
ratio regulatory requirements which became effective in 2011.
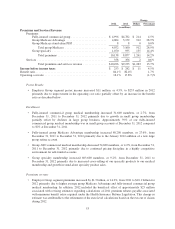
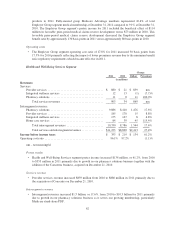
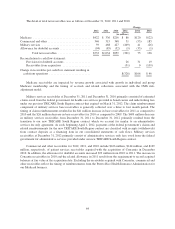
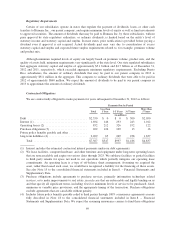
Health and Well-Being Services Segment
Change
2011 2010 Dollars Percentage
(in millions)
Revenues:
Services:
Provider services ...................................... $ 880 $ 21 $ 859 nm
Integrated wellness services ............................. 12 13 (1) (7.7)%
Pharmacy solutions .................................... 11 0 11 100.0%
Total services revenues ............................. 903 34 869 nm
Intersegment revenues:
Pharmacy solutions .................................... 9,886 8,410 1,476 17.6%
Provider services ...................................... 185 170 15 8.8%
Integrated wellness services ............................. 175 167 8 4.8%
Home care services .................................... 84 39 45 115.4%
Total intersegment revenues ......................... 10,330 8,786 1,544 17.6%
Total services and intersegment revenues ............... $11,233 $8,820 $2,413 27.4%
Income before income taxes $ 353 $ 219 $ 134 61.2%
Operating cost ratio ........................................ 96.1% 97.2% (1.1)%
nm – not meaningful
Pretax results
• Health and Well-Being Services segment pretax income increased $134 million, or 61.2%, from 2010
to $353 million in 2011 primarily due to growth in our pharmacy solutions business together with the
addition of the Concentra business, acquired on December 21, 2010.
Services revenue
• Provider services revenue increased $859 million from 2010 to $880 million in 2011 primarily due to
the acquisition of Concentra on December 21, 2010.
Intersegment revenues
• Intersegment revenues increased $1.5 billion, or 17.6%, from 2010 to $10.3 billion for 2011 primarily
due to growth in our pharmacy solutions business as it serves our growing membership, particularly
Medicare stand-alone PDP.
62