Humana 2012 Annual Report Download - page 69
Download and view the complete annual report
Please find page 69 of the 2012 Humana annual report below. You can navigate through the pages in the report by either clicking on the pages listed below, or by using the keyword search tool below to find specific information within the annual report.-
 1
1 -
2
-
3
-
4
-
5
-
6
-
7
-
8
-
9
-
10
-
11
-
12
-
13
-
14
-
15
-
16
-
17
-
18
-
19
-
20
-
21
-
22
-
23
-
24
-
25
-
26
-
27
-
28
-
29
-
30
-
31
-
32
-
33
-
34
-
35
-
36
-
37
-
38
-
39
-
40
-
41
-
42
-
43
-
44
-
45
-
46
-
47
-
48
-
49
-
50
-
51
-
52
-
53
-
54
-
55
-
56
-
57
-
58
-
 59
59 -
 60
60 -
 61
61 -
 62
62 -
 63
63 -
 64
64 -
 65
65 -
 66
66 -
 67
67 -
 68
68 -
 69
69 -
 70
70 -
 71
71 -
 72
72 -
 73
73 -
 74
74 -
 75
75 -
 76
76 -
 77
77 -
 78
78 -
 79
79 -
80
-
81
-
82
-
83
-
84
-
85
-
86
-
87
-
88
-
89
-
90
-
91
-
92
-
93
-
94
-
95
-
96
-
97
-
98
-
99
-
100
-
101
-
102
-
103
-
104
-
105
-
106
-
107
-
108
-
109
-
110
-
111
-
112
-
113
-
114
-
115
-
116
-
117
-
118
-
119
-
120
-
121
-
122
-
123
-
124
-
125
-
126
-
127
-
128
-
129
-
130
-
131
-
132
-
133
-
134
-
135
-
136
-
137
-
138
-
139
-
140
-
141
-
142
-
143
-
144
-
145
-
146
-
147
-
148
-
149
-
150
-
151
-
152
-
153
-
154
-
155
-
156
-
157
-
158
-
159
-
160
-
161
-
162
-
163
-
164
 |
 |

Change
2011 2010 Dollars Percentage
(in millions)
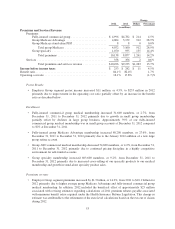
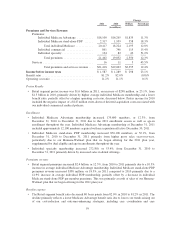
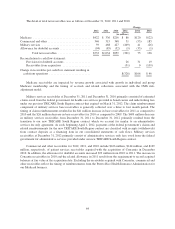
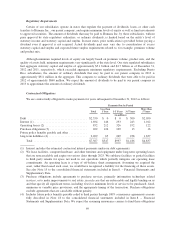
Premiums and Services Revenue:
Premiums:
Individual Medicare Advantage ........... $18,100 $16,265 $1,835 11.3%
Individual Medicare stand-alone PDP ...... 2,317 1,959 358 18.3%
Total individual Medicare ............ 20,417 18,224 2,193 12.0%
Individual commercial .................. 861 746 115 15.4%
Individual specialty ..................... 124 82 42 51.2%
Total premiums .................... 21,402 19,052 2,350 12.3%
Services .................................. 16 11 5 45.5%
Total premiums and services revenue . . . $21,418 $19,063 $2,355 12.4%
Income before income taxes $ 1,587 $ 1,289 $ 298 23.1%
Benefit ratio ................................... 81.2% 82.0% (0.8)%
Operating cost ratio ............................. 11.2% 11.1% 0.1%
Pretax Results
• Retail segment pretax income was $1.6 billion in 2011, an increase of $298 million, or 23.1%, from
$1.3 billion in 2010, primarily driven by higher average individual Medicare membership and a lower
benefit ratio, partially offset by a higher operating cost ratio, discussed below. Pretax income for 2010
included the negative impact of a $147 million write-down of deferred acquisition costs associated with
our individual commercial medical policies.
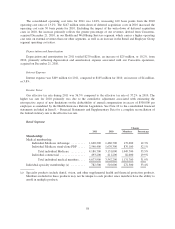
Enrollment
• Individual Medicare Advantage membership increased 179,600 members, or 12.3%, from
December 31, 2010 to December 31, 2011 due to the 2011 enrollment season as well as age-in
enrollment throughout the year. Individual Medicare Advantage membership at December 31, 2011
included approximately 12,100 members acquired with an acquisition effective December 30, 2011.
• Individual Medicare stand-alone PDP membership increased 870,100 members, or 52.1%, from
December 31, 2010 to December 31, 2011 primarily from higher gross sales year-over-year,
particularly due to our Humana-Walmart plan that we began offering for the 2011 plan year,
supplemented by dual eligible and age-in enrollments throughout the year.
• Individual specialty membership increased 272,500, or 53.4%, from December 31, 2010 to
December 31, 2011 primarily driven by increased sales in dental offerings.
Premiums revenue
• Retail segment premiums increased $2.4 billion, or 12.3%, from 2010 to 2011 primarily due to a 10.3%
increase in average individual Medicare Advantage membership. Individual Medicare stand-alone PDP
premiums revenue increased $358 million, or 18.3%, in 2011 compared to 2010 primarily due to a
41.9% increase in average individual PDP membership, partially offset by a decrease in individual
Medicare stand-alone PDP per member premiums. This was primarily a result of sales of our Humana-
Walmart plan that we began offering for the 2011 plan year.
Benefits expense
• The Retail segment benefit ratio decreased 80 basis points from 82.0% in 2010 to 81.2% in 2011. The
decline primarily reflects a lower Medicare Advantage benefit ratio due to lower cost trends arising out
of our cost-reduction and outcome-enhancing strategies, including care coordination and care
59