Humana 2012 Annual Report Download - page 65
Download and view the complete annual report
Please find page 65 of the 2012 Humana annual report below. You can navigate through the pages in the report by either clicking on the pages listed below, or by using the keyword search tool below to find specific information within the annual report.-
 1
1 -
2
-
3
-
4
-
5
-
6
-
7
-
8
-
9
-
10
-
11
-
12
-
13
-
14
-
15
-
16
-
17
-
18
-
19
-
20
-
21
-
22
-
23
-
24
-
25
-
26
-
27
-
28
-
29
-
30
-
31
-
32
-
33
-
34
-
35
-
36
-
37
-
38
-
39
-
40
-
41
-
42
-
43
-
44
-
45
-
46
-
47
-
48
-
49
-
50
-
51
-
52
-
53
-
54
-
 55
55 -
 56
56 -
 57
57 -
 58
58 -
 59
59 -
 60
60 -
 61
61 -
 62
62 -
 63
63 -
 64
64 -
 65
65 -
 66
66 -
 67
67 -
 68
68 -
 69
69 -
 70
70 -
 71
71 -
 72
72 -
 73
73 -
 74
74 -
 75
75 -
76
-
77
-
78
-
79
-
80
-
81
-
82
-
83
-
84
-
85
-
86
-
87
-
88
-
89
-
90
-
91
-
92
-
93
-
94
-
95
-
96
-
97
-
98
-
99
-
100
-
101
-
102
-
103
-
104
-
105
-
106
-
107
-
108
-
109
-
110
-
111
-
112
-
113
-
114
-
115
-
116
-
117
-
118
-
119
-
120
-
121
-
122
-
123
-
124
-
125
-
126
-
127
-
128
-
129
-
130
-
131
-
132
-
133
-
134
-
135
-
136
-
137
-
138
-
139
-
140
-
141
-
142
-
143
-
144
-
145
-
146
-
147
-
148
-
149
-
150
-
151
-
152
-
153
-
154
-
155
-
156
-
157
-
158
-
159
-
160
-
161
-
162
-
163
-
164
 |
 |
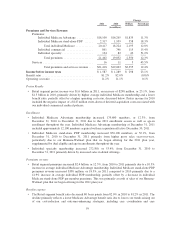
Script Volume
• Script volumes for the Retail and Employer Group segment membership increased to approximately
238 million in 2012, up approximately 15.5% versus scripts of approximately 206 million in 2011. The
year-over-year increase primarily reflects growth associated with higher average medical membership
together with an increase in mail order penetration for our Retail segment medical membership in 2012
than in 2011.
Services revenue
• Provider services revenue increased $87 million from 2011 to $967 million in 2012 primarily due to
growth in our Concentra operations and the acquisition of SeniorBridge in July 2012.
Intersegment revenues
• Intersegment revenues increased $1.6 billion, or 15.7%, from 2011 to $12.0 billion for 2012 primarily
due to growth in our pharmacy solutions business, including our mail-order pharmacy, as it serves our
growing membership, particularly Medicare stand-alone PDP.
Operating costs
• The Health and Well-Being Services segment operating cost ratio improved 60 basis points from 2011
to 95.5% for 2012 reflecting scale efficiencies associated with growth in our pharmacy solutions
business, including higher script volumes in our mail-order pharmacy business.
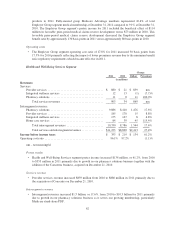
Other Businesses
Pretax loss for our Other Businesses of $19 million for 2012 compared to pretax income of $84 million for
2011. The year-over-year decline primarily reflects the combined effect of costs in connection with a litigation
settlement associated with our military services business in 2012, reserve strengthening for our closed block of
long-term care policies in 2012, and a change in profitability under the new TRICARE South Region contract in
connection with our bid strategy.
55