Humana 2012 Annual Report Download - page 61
Download and view the complete annual report
Please find page 61 of the 2012 Humana annual report below. You can navigate through the pages in the report by either clicking on the pages listed below, or by using the keyword search tool below to find specific information within the annual report.-
 1
1 -
2
-
3
-
4
-
5
-
6
-
7
-
8
-
9
-
10
-
11
-
12
-
13
-
14
-
15
-
16
-
17
-
18
-
19
-
20
-
21
-
22
-
23
-
24
-
25
-
26
-
27
-
28
-
29
-
30
-
31
-
32
-
33
-
34
-
35
-
36
-
37
-
38
-
39
-
40
-
41
-
42
-
43
-
44
-
45
-
46
-
47
-
48
-
49
-
50
-
 51
51 -
 52
52 -
 53
53 -
 54
54 -
 55
55 -
 56
56 -
 57
57 -
 58
58 -
 59
59 -
 60
60 -
 61
61 -
 62
62 -
 63
63 -
 64
64 -
 65
65 -
 66
66 -
 67
67 -
 68
68 -
 69
69 -
 70
70 -
 71
71 -
72
-
73
-
74
-
75
-
76
-
77
-
78
-
79
-
80
-
81
-
82
-
83
-
84
-
85
-
86
-
87
-
88
-
89
-
90
-
91
-
92
-
93
-
94
-
95
-
96
-
97
-
98
-
99
-
100
-
101
-
102
-
103
-
104
-
105
-
106
-
107
-
108
-
109
-
110
-
111
-
112
-
113
-
114
-
115
-
116
-
117
-
118
-
119
-
120
-
121
-
122
-
123
-
124
-
125
-
126
-
127
-
128
-
129
-
130
-
131
-
132
-
133
-
134
-
135
-
136
-
137
-
138
-
139
-
140
-
141
-
142
-
143
-
144
-
145
-
146
-
147
-
148
-
149
-
150
-
151
-
152
-
153
-
154
-
155
-
156
-
157
-
158
-
159
-
160
-
161
-
162
-
163
-
164
 |
 |

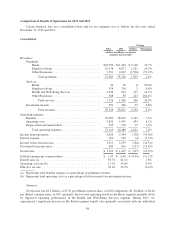
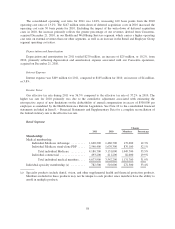
(a) Specialty products include dental, vision, and other supplemental health and financial protection products.
Members included in these products may not be unique to each product since members have the ability to
enroll in multiple products.
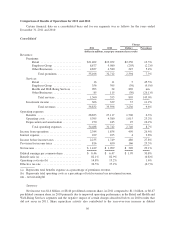
Change
2012 2011 Dollars Percentage
(in millions)
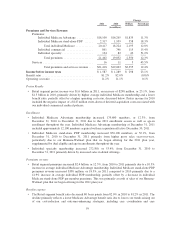
Premiums and Services Revenue:
Premiums:
Individual Medicare Advantage ....................... $20,788 $18,100 $2,688 14.9%
Individual Medicare stand-alone PDP .................. 2,587 2,317 270 11.7%
Total individual Medicare ........................ 23,375 20,417 2,958 14.5%
Individual commercial .............................. 1,004 861 143 16.6%
Individual specialty ................................. 171 124 47 37.9%
Total premiums ................................ 24,550 21,402 3,148 14.7%
Services .......................................... 24 16 8 50.0%
Total premiums and services revenue ............... $24,574 $21,418 $3,156 14.7%
Income before income taxes $ 1,162 $ 1,587 $ (425) (26.8)%
Benefit ratio ............................................... 84.1% 81.2% 2.9%
Operating cost ratio ......................................... 11.0% 11.2% (0.2)%
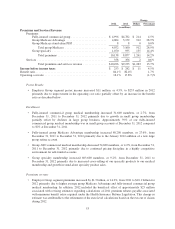
Pretax Results
• Retail segment pretax income was $1.2 billion in 2012, a decrease of $425 million, or 26.8%, from
$1.6 billion in 2011, primarily driven by a year-over-year increase in the benefit ratio partially offset by
improvement in the operating cost ratio as described below.
Enrollment
• Individual Medicare Advantage membership increased 287,300 members, or 17.5%, from
December 31, 2011 to December 31, 2012 primarily due to the 2012 enrollment season, as well as age-
in enrollment throughout the year. We acquired approximately 62,600 members with Arcadian
effective March 31, 2012. As discussed previously, we divested approximately 12,600 members
acquired with Arcadian effective January 1, 2013 in accordance with our agreement with the United
States Department of Justice.
• Individual Medicare stand-alone PDP membership increased 445,200 members, or 17.5%, from
December 31, 2011 to December 31, 2012 primarily from higher gross sales during the 2012
enrollment season, particularly for our Humana-Walmart plan offering, supplemented by dual-eligible
and age-in enrollments throughout the year.
• Individual specialty membership increased 166,200, or 21.2%, from December 31, 2011 to
December 31, 2012 primarily driven by increased membership in dental offerings.
Premiums revenue
• Retail segment premiums increased $3.1 billion, or 14.7%, from 2011 to 2012 primarily due to a 17.6%
increase in average individual Medicare Advantage membership. Individual Medicare Advantage per
member premiums decreased approximately 2% in 2012 compared to 2011, primarily driven by a
higher percentage of members that aged-in that generally carry a lower risk score than other members
and accordingly a lower premium per member as well as lower per member premiums for members
51