Humana 2012 Annual Report Download - page 63
Download and view the complete annual report
Please find page 63 of the 2012 Humana annual report below. You can navigate through the pages in the report by either clicking on the pages listed below, or by using the keyword search tool below to find specific information within the annual report.-
 1
1 -
2
-
3
-
4
-
5
-
6
-
7
-
8
-
9
-
10
-
11
-
12
-
13
-
14
-
15
-
16
-
17
-
18
-
19
-
20
-
21
-
22
-
23
-
24
-
25
-
26
-
27
-
28
-
29
-
30
-
31
-
32
-
33
-
34
-
35
-
36
-
37
-
38
-
39
-
40
-
41
-
42
-
43
-
44
-
45
-
46
-
47
-
48
-
49
-
50
-
51
-
52
-
 53
53 -
 54
54 -
 55
55 -
 56
56 -
 57
57 -
 58
58 -
 59
59 -
 60
60 -
 61
61 -
 62
62 -
 63
63 -
 64
64 -
 65
65 -
 66
66 -
 67
67 -
 68
68 -
 69
69 -
 70
70 -
 71
71 -
 72
72 -
 73
73 -
74
-
75
-
76
-
77
-
78
-
79
-
80
-
81
-
82
-
83
-
84
-
85
-
86
-
87
-
88
-
89
-
90
-
91
-
92
-
93
-
94
-
95
-
96
-
97
-
98
-
99
-
100
-
101
-
102
-
103
-
104
-
105
-
106
-
107
-
108
-
109
-
110
-
111
-
112
-
113
-
114
-
115
-
116
-
117
-
118
-
119
-
120
-
121
-
122
-
123
-
124
-
125
-
126
-
127
-
128
-
129
-
130
-
131
-
132
-
133
-
134
-
135
-
136
-
137
-
138
-
139
-
140
-
141
-
142
-
143
-
144
-
145
-
146
-
147
-
148
-
149
-
150
-
151
-
152
-
153
-
154
-
155
-
156
-
157
-
158
-
159
-
160
-
161
-
162
-
163
-
164
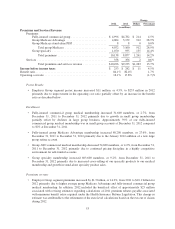
 |
 |

Change
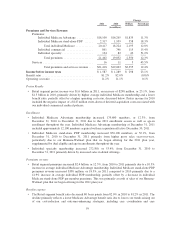
2012 2011 Dollars Percentage
(in millions)
Premiums and Services Revenue:
Premiums:
Fully-insured commercial group ........................ $ 4,996 $4,782 $ 214 4.5%
Group Medicare Advantage ........................... 4,064 3,152 912 28.9%
Group Medicare stand-alone PDP ....................... 8 8 0 0.0%
Total group Medicare ............................ 4,072 3,160 912 28.9%
Group specialty ..................................... 1,070 935 135 14.4%
Total premiums ................................. 10,138 8,877 1,261 14.2%
Services ............................................... 358 356 2 0.6%
Total premiums and services revenue ................ $10,496 $9,233 $1,263 13.7%
Income before income taxes $ 253 $ 242 $ 11 4.5%
Benefit ratio ................................................ 84.1% 82.4% 1.7%
Operating cost ratio .......................................... 16.1% 17.8% (1.7)%
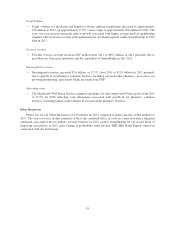
Pretax Results
• Employer Group segment pretax income increased $11 million, or 4.5%, to $253 million in 2012
primarily due to improvement in the operating cost ratio partially offset by an increase in the benefit
ratio as described below.
Enrollment
• Fully-insured commercial group medical membership increased 31,600 members, or 2.7%, from
December 31, 2011 to December 31, 2012 primarily due to growth in small group membership
partially offset by declines in large group business. Approximately 59% of our fully-insured
commercial group medical membership was in small group accounts at December 31, 2012 compared
to 56% at December 31, 2011.
• Fully-insured group Medicare Advantage membership increased 80,200 members, or 27.6%, from
December 31, 2011 to December 31, 2012 primarily due to the January 2012 addition of a new large
group retiree account.
• Group ASO commercial medical membership decreased 54,600 members, or 4.2%, from December 31,
2011 to December 31, 2012 primarily due to continued pricing discipline in a highly competitive
environment for self-funded accounts.
• Group specialty membership increased 603,600 members, or 9.2%, from December 31, 2011 to
December 31, 2012 primarily due to increased cross-selling of our specialty products to our medical
membership and growth in stand-alone specialty product sales.
Premiums revenue
• Employer Group segment premiums increased by $1.3 billion, or 14.2%, from 2011 to $10.1 billion for
2012 primarily due to higher average group Medicare Advantage and fully-insured commercial group
medical membership. In addition, 2012 included the beneficial effect of approximately $25 million
associated with revising estimates regarding calculations of 2011 premium rebates payable associated
with minimum benefit ratios required under the Health Insurance Reform Legislation. This change in
estimate was attributable to the refinement of the state-level calculations based on the run out of claims
during 2012.
53