Humana 2012 Annual Report Download - page 117
Download and view the complete annual report
Please find page 117 of the 2012 Humana annual report below. You can navigate through the pages in the report by either clicking on the pages listed below, or by using the keyword search tool below to find specific information within the annual report.-
 1
1 -
2
-
3
-
4
-
5
-
6
-
7
-
8
-
9
-
10
-
11
-
12
-
13
-
14
-
15
-
16
-
17
-
18
-
19
-
20
-
21
-
22
-
23
-
24
-
25
-
26
-
27
-
28
-
29
-
30
-
31
-
32
-
33
-
34
-
35
-
36
-
37
-
38
-
39
-
40
-
41
-
42
-
43
-
44
-
45
-
46
-
47
-
48
-
49
-
50
-
51
-
52
-
53
-
54
-
55
-
56
-
57
-
58
-
59
-
60
-
61
-
62
-
63
-
64
-
65
-
66
-
67
-
68
-
69
-
70
-
71
-
72
-
73
-
74
-
75
-
76
-
77
-
78
-
79
-
80
-
81
-
82
-
83
-
84
-
85
-
86
-
87
-
88
-
89
-
90
-
91
-
92
-
93
-
94
-
95
-
96
-
97
-
98
-
99
-
100
-
101
-
102
-
103
-
104
-
105
-
106
-
 107
107 -
 108
108 -
 109
109 -
 110
110 -
 111
111 -
 112
112 -
 113
113 -
 114
114 -
 115
115 -
 116
116 -
 117
117 -
 118
118 -
 119
119 -
 120
120 -
 121
121 -
 122
122 -
 123
123 -
 124
124 -
 125
125 -
 126
126 -
 127
127 -
128
-
129
-
130
-
131
-
132
-
133
-
134
-
135
-
136
-
137
-
138
-
139
-
140
-
141
-
142
-
143
-
144
-
145
-
146
-
147
-
148
-
149
-
150
-
151
-
152
-
153
-
154
-
155
-
156
-
157
-
158
-
159
-
160
-
161
-
162
-
163
-
164
 |
 |

Humana Inc.
NOTES TO CONSOLIDATED FINANCIAL STATEMENTS—(Continued)
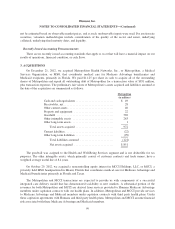
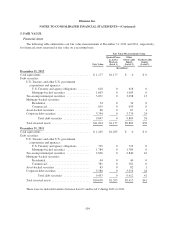
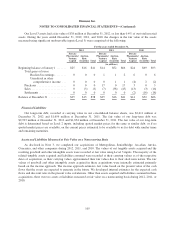
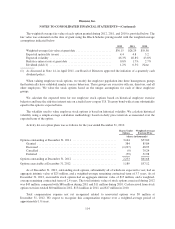
The following table presents details of our other intangible assets included in other long-term assets in the
accompanying consolidated balance sheets at December 31, 2012 and 2011:
Weighted
Average
Life
2012 2011
Cost
Accumulated
Amortization Net Cost
Accumulated
Amortization Net
(in millions)
Other intangible assets:
Customer contracts/relationships . . . 9.5 yrs $ 733 $237 $496 $429 $182 $247
Trade names and technology ...... 13.6 yrs 190 21 169 135 6 129
Provider contracts ............... 15.0 yrs 51 19 32 44 15 29
Noncompetes and other .......... 6.5yrs 51 17 34 40 10 30
Total other intangible assets . . . 10.4 yrs $1,025 $294 $731 $648 $213 $435
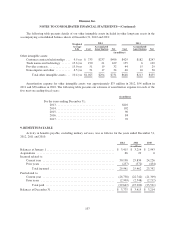
Amortization expense for other intangible assets was approximately $75 million in 2012, $54 million in
2011 and $38 million in 2010. The following table presents our estimate of amortization expense for each of the
five next succeeding fiscal years:
(in millions)
For the years ending December 31,:
2013 ........................................ $110
2014 ........................................ 102
2015 ........................................ 90
2016 ........................................ 84
2017 ........................................ 76
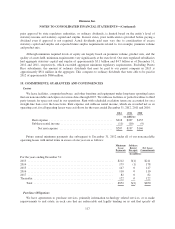
9. BENEFITS PAYABLE
Activity in benefits payable, excluding military services, was as follows for the years ended December 31,
2012, 2011 and 2010:
2012 2011 2010
(in millions)
Balances at January 1 .............................................. $ 3,415 $ 3,214 $ 2,943
Acquisitions ..................................................... 66 29 0
Incurred related to:
Current year ................................................. 30,198 25,834 24,226
Prior years .................................................. (257) (372) (434)
Total incurred ............................................ 29,941 25,462 23,792
Paid related to:
Current year ................................................. (26,738) (22,742) (21,309)
Prior years .................................................. (2,909) (2,548) (2,212)
Total paid ............................................... (29,647) (25,290) (23,521)
Balances at December 31 ........................................... $ 3,775 $ 3,415 $ 3,214
107