Humana 2012 Annual Report Download - page 135
Download and view the complete annual report
Please find page 135 of the 2012 Humana annual report below. You can navigate through the pages in the report by either clicking on the pages listed below, or by using the keyword search tool below to find specific information within the annual report.-
 1
1 -
2
-
3
-
4
-
5
-
6
-
7
-
8
-
9
-
10
-
11
-
12
-
13
-
14
-
15
-
16
-
17
-
18
-
19
-
20
-
21
-
22
-
23
-
24
-
25
-
26
-
27
-
28
-
29
-
30
-
31
-
32
-
33
-
34
-
35
-
36
-
37
-
38
-
39
-
40
-
41
-
42
-
43
-
44
-
45
-
46
-
47
-
48
-
49
-
50
-
51
-
52
-
53
-
54
-
55
-
56
-
57
-
58
-
59
-
60
-
61
-
62
-
63
-
64
-
65
-
66
-
67
-
68
-
69
-
70
-
71
-
72
-
73
-
74
-
75
-
76
-
77
-
78
-
79
-
80
-
81
-
82
-
83
-
84
-
85
-
86
-
87
-
88
-
89
-
90
-
91
-
92
-
93
-
94
-
95
-
96
-
97
-
98
-
99
-
100
-
101
-
102
-
103
-
104
-
105
-
106
-
107
-
108
-
109
-
110
-
111
-
112
-
113
-
114
-
115
-
116
-
117
-
118
-
119
-
120
-
121
-
122
-
123
-
124
-
 125
125 -
 126
126 -
 127
127 -
 128
128 -
 129
129 -
 130
130 -
 131
131 -
 132
132 -
 133
133 -
 134
134 -
 135
135 -
 136
136 -
 137
137 -
 138
138 -
 139
139 -
 140
140 -
 141
141 -
 142
142 -
 143
143 -
 144
144 -
 145
145 -
146
-
147
-
148
-
149
-
150
-
151
-
152
-
153
-
154
-
155
-
156
-
157
-
158
-
159
-
160
-
161
-
162
-
163
-
164
 |
 |

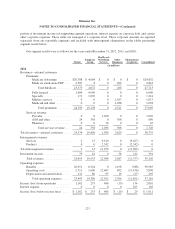
Humana Inc.
NOTES TO CONSOLIDATED FINANCIAL STATEMENTS—(Continued)
Retail
Employer
Group
Health and
Well-Being
Services
Other
Businesses
Eliminations/
Corporate Consolidated
(in millions)
2010
Revenues—external customers
Premiums:
Medicare Advantage .......... $16,265 $3,021 $ 0 $ 0 $ 0 $19,286
Medicare stand-alone PDP ...... 1,959 5 0 355 0 2,319
Total Medicare ........... 18,224 3,026 0 355 0 21,605
Fully-insured ................ 746 5,169 0 0 0 5,915
Specialty .................... 82 885 0 0 0 967
Military services ............. 0 0 0 3,462 0 3,462
Medicaid and other ........... 0 0 0 763 0 763
Total premiums .......... 19,052 9,080 0 4,580 0 32,712
Services revenue:
Provider .................... 0 0 34 0 0 34
ASO and other ............... 11 395 0 115 0 521
Pharmacy ................... 0 0 0 0 0 0
Total services revenue ..... 11 395 34 115 0 555
Total revenues—external customers ...... 19,063 9,475 34 4,695 0 33,267
Intersegment revenues
Services ........................ 0 12 7,494 0 (7,506) 0
Products ........................ 0 0 1,292 0 (1,292) 0
Total intersegment revenues ............ 0 12 8,786 0 (8,798) 0
Investment income .................... 80 42 0 43 164 329
Total revenues ................... 19,143 9,529 8,820 4,738 (8,634) 33,596
Operating expenses:
Benefits ........................ 15,624 7,486 0 4,253 (246) 27,117
Operating costs .................. 2,113 1,662 8,575 475 (8,445) 4,380
Depreciation and amortization ....... 117 93 26 12 (3) 245
Total operating expenses ....... 17,854 9,241 8,601 4,740 (8,694) 31,742
Income (loss) from operations ........... 1,289 288 219 (2) 60 1,854
Interest expense ...................... 0 0 0 0 105 105
Income (loss) before income taxes ....... $ 1,289 $ 288 $ 219 $ (2) $ (45) $ 1,749
Retail segment operating costs for 2010 include $147 million for the write-down of deferred acquisition
costs associated with our individual commercial medical policies as discussed more fully in Note 17.
Benefits expense for Other Businesses for 2010 includes $139 million for reserve strengthening associated
with our closed block of long-term care policies as discussed more fully in Note 17.
125