Humana 2012 Annual Report Download - page 75
Download and view the complete annual report
Please find page 75 of the 2012 Humana annual report below. You can navigate through the pages in the report by either clicking on the pages listed below, or by using the keyword search tool below to find specific information within the annual report.-
 1
1 -
2
-
3
-
4
-
5
-
6
-
7
-
8
-
9
-
10
-
11
-
12
-
13
-
14
-
15
-
16
-
17
-
18
-
19
-
20
-
21
-
22
-
23
-
24
-
25
-
26
-
27
-
28
-
29
-
30
-
31
-
32
-
33
-
34
-
35
-
36
-
37
-
38
-
39
-
40
-
41
-
42
-
43
-
44
-
45
-
46
-
47
-
48
-
49
-
50
-
51
-
52
-
53
-
54
-
55
-
56
-
57
-
58
-
59
-
60
-
61
-
62
-
63
-
64
-
 65
65 -
 66
66 -
 67
67 -
 68
68 -
 69
69 -
 70
70 -
 71
71 -
 72
72 -
 73
73 -
 74
74 -
 75
75 -
 76
76 -
 77
77 -
 78
78 -
 79
79 -
 80
80 -
 81
81 -
 82
82 -
 83
83 -
 84
84 -
 85
85 -
86
-
87
-
88
-
89
-
90
-
91
-
92
-
93
-
94
-
95
-
96
-
97
-
98
-
99
-
100
-
101
-
102
-
103
-
104
-
105
-
106
-
107
-
108
-
109
-
110
-
111
-
112
-
113
-
114
-
115
-
116
-
117
-
118
-
119
-
120
-
121
-
122
-
123
-
124
-
125
-
126
-
127
-
128
-
129
-
130
-
131
-
132
-
133
-
134
-
135
-
136
-
137
-
138
-
139
-
140
-
141
-
142
-
143
-
144
-
145
-
146
-
147
-
148
-
149
-
150
-
151
-
152
-
153
-
154
-
155
-
156
-
157
-
158
-
159
-
160
-
161
-
162
-
163
-
164
 |
 |

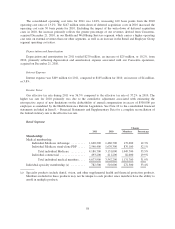
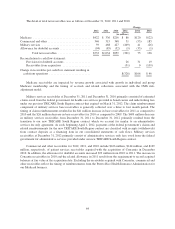
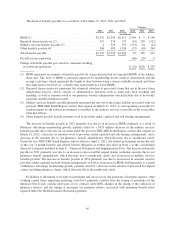
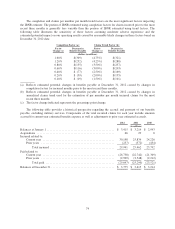
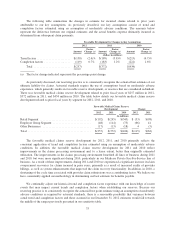
The detail of benefits payable was as follows at December 31, 2012, 2011 and 2010:
Change
2012 2011 2010 2012 2011 2010
(in millions)
IBNR (1) ......................................... $2,552 $2,056 $2,051 $ 496$5$148
Reported claims in process (2) ........................ 315 376 137 (61) 239 (221)
Military services benefits payable (3) ................... 4 339 255 (335) 84 (24)
Other benefits payable (4) ............................ 908 983 1,026 (75) (43) 344
Total benefits payable ............................... $3,779 $3,754 $3,469 25 285 247
Payables from acquisition ............................ (66) (29) 0
Change in benefits payable per cash flow statement resulting
in cash from operations ............................ $ (41) $256 $ 247
(1) IBNR represents an estimate of benefits payable for claims incurred but not reported (IBNR) at the balance
sheet date. The level of IBNR is primarily impacted by membership levels, medical claim trends and the
receipt cycle time, which represents the length of time between when a claim is initially incurred and when
the claim form is received (i.e. a shorter time span results in a lower IBNR).
(2) Reported claims in process represents the estimated valuation of processed claims that are in the post claim
adjudication process, which consists of administrative functions such as audit and check batching and
handling, as well as amounts owed to our pharmacy benefit administrator which fluctuate due to bi-weekly
payments and the month-end cutoff.
(3) Military services benefits payable primarily represents the run-out of the claims liability associated with our
previous TRICARE South Region contract that expired on March 31, 2012. A corresponding receivable for
reimbursement by the federal government is included in the military services receivable in the receivables
table that follows.
(4) Other benefits payable include amounts owed to providers under capitated and risk sharing arrangements.
The increase in benefits payable in 2012 primarily was due to an increase in IBNR, primarily as a result of
Medicare Advantage membership growth, partially offset by a $335 million decrease in the military services
benefits payable due to the run-out of claims under the previous TRICARE South Region contract that expired on
March 31, 2012, a decrease in amounts owed to providers under capitated and risk sharing arrangements, and a
decrease in the amounts due to our pharmacy benefit administrator which fluctuate due to month-end cutoff.
Under the new TRICARE South Region contract effective April 1, 2012, the federal government retains the risk
of the cost of health benefits and related benefit obligation as further described in Note 2 to the consolidated
financial statements included in Item 8. – Financial Statements and Supplementary Data. The increase in benefits
payable in 2011 primarily was due to an increase in processed but unpaid claims, including amounts due to our
pharmacy benefit administrator, which fluctuate due to month-end cutoff, and an increase in military services
benefits payable. The increase in benefits payable in 2010 primarily was due to an increase in amounts owed to
providers under capitated and risk sharing arrangements as well as an increase in IBNR, both primarily as a result
of Medicare Advantage membership growth, partially offset by a decrease in the amount of processed but unpaid
claims, including pharmacy claims, which fluctuate due to the month-end cutoff.
In addition to the timing of receipts for premiums and services fees and payments of benefits expense, other
working capital items impacting operating cash flows primarily resulted from the timing of payments for the
Medicare Part D risk corridor provisions of our contracts with CMS, changes in the timing of the collection of
pharmacy rebates, and the timing of payments for premium rebates associated with minimum benefit ratios
required under the Health Insurance Reform Legislation.
65