Humana 2012 Annual Report Download - page 91
Download and view the complete annual report
Please find page 91 of the 2012 Humana annual report below. You can navigate through the pages in the report by either clicking on the pages listed below, or by using the keyword search tool below to find specific information within the annual report.-
 1
1 -
2
-
3
-
4
-
5
-
6
-
7
-
8
-
9
-
10
-
11
-
12
-
13
-
14
-
15
-
16
-
17
-
18
-
19
-
20
-
21
-
22
-
23
-
24
-
25
-
26
-
27
-
28
-
29
-
30
-
31
-
32
-
33
-
34
-
35
-
36
-
37
-
38
-
39
-
40
-
41
-
42
-
43
-
44
-
45
-
46
-
47
-
48
-
49
-
50
-
51
-
52
-
53
-
54
-
55
-
56
-
57
-
58
-
59
-
60
-
61
-
62
-
63
-
64
-
65
-
66
-
67
-
68
-
69
-
70
-
71
-
72
-
73
-
74
-
75
-
76
-
77
-
78
-
79
-
80
-
 81
81 -
 82
82 -
 83
83 -
 84
84 -
 85
85 -
 86
86 -
 87
87 -
 88
88 -
 89
89 -
 90
90 -
 91
91 -
 92
92 -
 93
93 -
 94
94 -
 95
95 -
 96
96 -
 97
97 -
 98
98 -
 99
99 -
 100
100 -
 101
101 -
102
-
103
-
104
-
105
-
106
-
107
-
108
-
109
-
110
-
111
-
112
-
113
-
114
-
115
-
116
-
117
-
118
-
119
-
120
-
121
-
122
-
123
-
124
-
125
-
126
-
127
-
128
-
129
-
130
-
131
-
132
-
133
-
134
-
135
-
136
-
137
-
138
-
139
-
140
-
141
-
142
-
143
-
144
-
145
-
146
-
147
-
148
-
149
-
150
-
151
-
152
-
153
-
154
-
155
-
156
-
157
-
158
-
159
-
160
-
161
-
162
-
163
-
164
 |
 |

Approximately 94% of our debt securities were investment-grade quality, with a weighted average credit
rating of AA- by S&P at December 31, 2012. Most of the debt securities that were below investment-grade were
rated BB, the higher end of the below investment-grade rating scale. Our investment policy limits investments in
a single issuer and requires diversification among various asset types.
Tax-exempt municipal securities included pre-refunded bonds of $311 million at December 31, 2012 and
$332 million at December 31, 2011. These pre-refunded bonds were secured by an escrow fund consisting of
U.S. government obligations sufficient to pay off all amounts outstanding at maturity. The ratings of these pre-
refunded bonds generally assume the rating of the government obligations at the time the fund is established.
Tax-exempt municipal securities that were not pre-refunded were diversified among general obligation bonds of
U.S. states and local municipalities as well as special revenue bonds. General obligation bonds, which are backed
by the taxing power and full faith of the issuer, accounted for $1.1 billion of these municipals in the
portfolio. Special revenue bonds, issued by a municipality to finance a specific public works project such as
utilities, water and sewer, transportation, or education, and supported by the revenues of that project, accounted
for $1.7 billion of these municipals. Our general obligation bonds are diversified across the U.S. with no
individual state exceeding 11%. In addition, certain monoline insurers guarantee the timely repayment of bond
principal and interest when a bond issuer defaults and generally provide credit enhancement for bond issues
related to our tax-exempt municipal securities. We have no direct exposure to these monoline insurers. We
owned $627 million and $634 million at December 31, 2012 and 2011, respectively, of tax-exempt securities
guaranteed by monoline insurers. The equivalent weighted average S&P credit rating of these tax-exempt
securities without the guarantee from the monoline insurer was AA-.
Our direct exposure to subprime mortgage lending is limited to investment in residential mortgage-backed
securities and asset-backed securities backed by home equity loans. The fair value of securities backed by Alt-A
and subprime loans was $2 million at December 31, 2012 and $3 million at December 31, 2011. There are no
collateralized debt obligations or structured investment vehicles in our investment portfolio.
The percentage of corporate securities associated with the financial services industry was 22.8% at
December 31, 2012 and 19.3% at December 31, 2011.
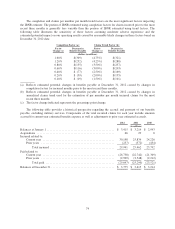
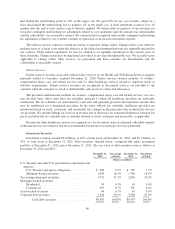
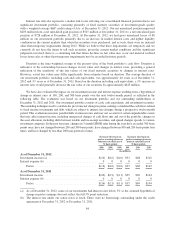
Gross unrealized losses and fair values aggregated by investment category and length of time that individual
securities have been in a continuous unrealized loss position were as follows at December 31, 2012:
Less than 12 months 12 months or more Total
Fair
Value
Gross
Unrealized
Losses
Fair
Value
Gross
Unrealized
Losses
Fair
Value
Gross
Unrealized
Losses
(in millions)
December 31, 2012
U.S. Treasury and other U.S. government
corporations and agencies:
U.S. Treasury and agency obligations .... $ 56 $0 $ 2 $0 $ 58 $0
Mortgage-backed securities ............ 38 0 25 (1) 63 (1)
Tax-exempt municipal securities ............ 233 (3) 27 (1) 260 (4)
Mortgage-backed securities:
Residential ......................... 0 0 4 (1) 4 (1)
Commercial ........................ 94 0 0 0 94 0
Asset-backed securities ................... 2 0 4 0 6 0
Corporate debt securities .................. 104 (2) 4 0 108 (2)
Total debt securities .............. $527 $(5) $66 $(3) $593 $(8)
Under the other-than-temporary impairment model for debt securities held, we recognize an impairment loss
in income in an amount equal to the full difference between the amortized cost basis and the fair value when we
81