Humana 2012 Annual Report Download - page 58
Download and view the complete annual report
Please find page 58 of the 2012 Humana annual report below. You can navigate through the pages in the report by either clicking on the pages listed below, or by using the keyword search tool below to find specific information within the annual report.-
 1
1 -
2
-
3
-
4
-
5
-
6
-
7
-
8
-
9
-
10
-
11
-
12
-
13
-
14
-
15
-
16
-
17
-
18
-
19
-
20
-
21
-
22
-
23
-
24
-
25
-
26
-
27
-
28
-
29
-
30
-
31
-
32
-
33
-
34
-
35
-
36
-
37
-
38
-
39
-
40
-
41
-
42
-
43
-
44
-
45
-
46
-
47
-
 48
48 -
 49
49 -
 50
50 -
 51
51 -
 52
52 -
 53
53 -
 54
54 -
 55
55 -
 56
56 -
 57
57 -
 58
58 -
 59
59 -
 60
60 -
 61
61 -
 62
62 -
 63
63 -
 64
64 -
 65
65 -
 66
66 -
 67
67 -
 68
68 -
69
-
70
-
71
-
72
-
73
-
74
-
75
-
76
-
77
-
78
-
79
-
80
-
81
-
82
-
83
-
84
-
85
-
86
-
87
-
88
-
89
-
90
-
91
-
92
-
93
-
94
-
95
-
96
-
97
-
98
-
99
-
100
-
101
-
102
-
103
-
104
-
105
-
106
-
107
-
108
-
109
-
110
-
111
-
112
-
113
-
114
-
115
-
116
-
117
-
118
-
119
-
120
-
121
-
122
-
123
-
124
-
125
-
126
-
127
-
128
-
129
-
130
-
131
-
132
-
133
-
134
-
135
-
136
-
137
-
138
-
139
-
140
-
141
-
142
-
143
-
144
-
145
-
146
-
147
-
148
-
149
-
150
-
151
-
152
-
153
-
154
-
155
-
156
-
157
-
158
-
159
-
160
-
161
-
162
-
163
-
164
 |
 |

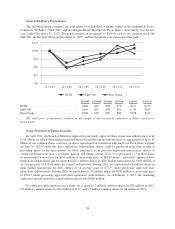
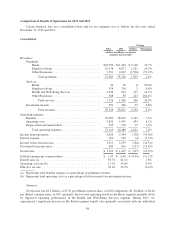
Comparison of Results of Operations for 2012 and 2011
Certain financial data on a consolidated basis and for our segments was as follows for the years ended
December 31, 2012 and 2011:
Consolidated
Change
2012 2011 Dollars Percentage
(dollars in millions, except per
common share results)
Revenues:
Premiums:
Retail ......................................... $24,550 $21,402 $ 3,148 14.7%
Employer Group ................................ 10,138 8,877 1,261 14.2%
Other Businesses ................................ 2,321 4,827 (2,506) (51.9)%
Total premiums ............................. 37,009 35,106 1,903 5.4%
Services:
Retail ......................................... 24 16 8 50.0%
Employer Group ................................ 358 356 2 0.6%
Health and Well-Being Services .................... 1,036 903 133 14.7%
Other Businesses ................................ 308 85 223 262.4%
Total services ............................... 1,726 1,360 366 26.9%
Investment income ................................... 391 366 25 6.8%
Total revenues .............................. 39,126 36,832 2,294 6.2%
Operating expenses:
Benefits ........................................... 30,985 28,823 2,162 7.5%
Operating costs ..................................... 5,830 5,395 435 8.1%
Depreciation and amortization .......................... 295 270 25 9.3%
Total operating expenses .......................... 37,110 34,488 2,622 7.6%
Income from operations ................................... 2,016 2,344 (328) (14.0)%
Interest expense ......................................... 105 109 (4) (3.7)%
Income before income taxes ............................... 1,911 2,235 (324) (14.5)%
Provision for income taxes ................................ 689 816 (127) (15.6)%
Net income ............................................. $ 1,222 $ 1,419 $ (197) (13.9)%
Diluted earnings per common share ......................... $ 7.47 $ 8.46 $ (0.99) (11.7)%
Benefit ratio (a) ......................................... 83.7% 82.1% 1.6%
Operating cost ratio (b) ................................... 15.1% 14.8% 0.3%
Effective tax rate ........................................ 36.1% 36.5% (0.4)%
(a) Represents total benefits expense as a percentage of premiums revenue.
(b) Represents total operating costs as a percentage of total revenues less investment income.
Summary
Net income was $1.2 billion, or $7.47 per diluted common share, in 2012 compared to $1.4 billion, or $8.46
per diluted common share, in 2011 primarily due to lower operating results in the Retail segment, partially offset
by improved operating performance in the Health and Well-Being Services segment. During 2012, we
experienced a significant increase in the Retail segment benefit ratio primarily associated with our individual
48