Humana 2012 Annual Report Download - page 49
Download and view the complete annual report
Please find page 49 of the 2012 Humana annual report below. You can navigate through the pages in the report by either clicking on the pages listed below, or by using the keyword search tool below to find specific information within the annual report.-
 1
1 -
2
-
3
-
4
-
5
-
6
-
7
-
8
-
9
-
10
-
11
-
12
-
13
-
14
-
15
-
16
-
17
-
18
-
19
-
20
-
21
-
22
-
23
-
24
-
25
-
26
-
27
-
28
-
29
-
30
-
31
-
32
-
33
-
34
-
35
-
36
-
37
-
38
-
 39
39 -
 40
40 -
 41
41 -
 42
42 -
 43
43 -
 44
44 -
 45
45 -
 46
46 -
 47
47 -
 48
48 -
 49
49 -
 50
50 -
 51
51 -
 52
52 -
 53
53 -
 54
54 -
 55
55 -
 56
56 -
 57
57 -
 58
58 -
 59
59 -
60
-
61
-
62
-
63
-
64
-
65
-
66
-
67
-
68
-
69
-
70
-
71
-
72
-
73
-
74
-
75
-
76
-
77
-
78
-
79
-
80
-
81
-
82
-
83
-
84
-
85
-
86
-
87
-
88
-
89
-
90
-
91
-
92
-
93
-
94
-
95
-
96
-
97
-
98
-
99
-
100
-
101
-
102
-
103
-
104
-
105
-
106
-
107
-
108
-
109
-
110
-
111
-
112
-
113
-
114
-
115
-
116
-
117
-
118
-
119
-
120
-
121
-
122
-
123
-
124
-
125
-
126
-
127
-
128
-
129
-
130
-
131
-
132
-
133
-
134
-
135
-
136
-
137
-
138
-
139
-
140
-
141
-
142
-
143
-
144
-
145
-
146
-
147
-
148
-
149
-
150
-
151
-
152
-
153
-
154
-
155
-
156
-
157
-
158
-
159
-
160
-
161
-
162
-
163
-
164
 |
 |

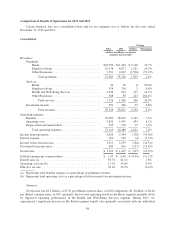
ITEM 6. SELECTED FINANCIAL DATA
2012 (a) 2011 (b) 2010 (c) 2009 2008 (d)
(dollars in millions, except per common share results)
Summary of Operating Results:
Revenues:
Premiums ..................... $ 37,009 $ 35,106 $ 32,712 $ 29,927 $ 28,065
Services ....................... 1,726 1,360 555 520 468
Investment income .............. 391 366 329 296 220
Total revenues .............. 39,126 36,832 33,596 30,743 28,753
Operating expenses:
Benefits ....................... 30,985 28,823 27,117 24,784 23,730
Operating costs ................. 5,830 5,395 4,380 4,014 3,740
Depreciation and amortization ..... 295 270 245 237 210
Total operating expenses ..... 37,110 34,488 31,742 29,035 27,680
Income from operations .............. 2,016 2,344 1,854 1,708 1,073
Interest expense ..................... 105 109 105 106 80
Income before income taxes ........... 1,911 2,235 1,749 1,602 993
Provision for income taxes ............ 689 816 650 562 346
Net income ........................ $ 1,222 $ 1,419 $ 1,099 $ 1,040 $ 647
Basic earnings per common share ...... $ 7.56 $ 8.58 $ 6.55 $ 6.21 $ 3.87
Diluted earnings per common share ..... $ 7.47 $ 8.46 $ 6.47 $ 6.15 $ 3.83
Dividends declared per common share . . . $ 1.03 $ 0.75 $ 0.00 $ 0.00 $ 0.00
Financial Position:
Cash and investments ................ $ 11,153 $ 10,830 $ 10,046 $ 9,111 $ 7,186
Total assets ........................ 19,979 17,708 16,103 14,153 13,042
Benefits payable .................... 3,779 3,754 3,469 3,222 3,206
Debt .............................. 2,611 1,659 1,669 1,678 1,937
Stockholders’ equity ................. 8,847 8,063 6,924 5,776 4,457
Cash flows from operations .......... $ 1,923 $ 2,079 $ 2,242 $ 1,422 $ 982
Key Financial Indicators:
Benefit ratio ....................... 83.7 % 82.1 % 82.9 % 82.8 % 84.6 %
Operating cost ratio .................. 15.1 % 14.8 % 13.2 % 13.2 % 13.1 %
Membership by Segment:
Retail segment:
Medical membership ............. 5,434,600 4,673,900 3,542,200 3,729,400 4,764,900
Specialty membership ............ 948,700 782,500 510,000 297,300 324,600
Employer Group segment:
Medical membership ............. 2,852,400 2,794,900 3,009,500 3,117,800 3,358,400
Specialty membership ............ 7,136,200 6,532,600 6,517,500 6,761,900 6,244,100
Other Businesses:
Medical membership ............. 3,801,800 3,715,800 3,734,900 3,486,800 3,488,900
Consolidated:
Total medical membership ........ 12,088,800 11,184,600 10,286,600 10,334,000 11,612,200
Total specialty membership ....... 8,084,900 7,315,100 7,027,500 7,059,200 6,568,700
(a) Includes the acquired operations of Arcadian Management Services, Inc. from March 31, 2012,
SeniorBridge Family Companies, Inc. from July 6, 2012, and Metropolitan Health Networks, Inc. from
39