Humana 2012 Annual Report Download - page 70
Download and view the complete annual report
Please find page 70 of the 2012 Humana annual report below. You can navigate through the pages in the report by either clicking on the pages listed below, or by using the keyword search tool below to find specific information within the annual report.-
 1
1 -
2
-
3
-
4
-
5
-
6
-
7
-
8
-
9
-
10
-
11
-
12
-
13
-
14
-
15
-
16
-
17
-
18
-
19
-
20
-
21
-
22
-
23
-
24
-
25
-
26
-
27
-
28
-
29
-
30
-
31
-
32
-
33
-
34
-
35
-
36
-
37
-
38
-
39
-
40
-
41
-
42
-
43
-
44
-
45
-
46
-
47
-
48
-
49
-
50
-
51
-
52
-
53
-
54
-
55
-
56
-
57
-
58
-
59
-
 60
60 -
 61
61 -
 62
62 -
 63
63 -
 64
64 -
 65
65 -
 66
66 -
 67
67 -
 68
68 -
 69
69 -
 70
70 -
 71
71 -
 72
72 -
 73
73 -
 74
74 -
 75
75 -
 76
76 -
 77
77 -
 78
78 -
 79
79 -
 80
80 -
81
-
82
-
83
-
84
-
85
-
86
-
87
-
88
-
89
-
90
-
91
-
92
-
93
-
94
-
95
-
96
-
97
-
98
-
99
-
100
-
101
-
102
-
103
-
104
-
105
-
106
-
107
-
108
-
109
-
110
-
111
-
112
-
113
-
114
-
115
-
116
-
117
-
118
-
119
-
120
-
121
-
122
-
123
-
124
-
125
-
126
-
127
-
128
-
129
-
130
-
131
-
132
-
133
-
134
-
135
-
136
-
137
-
138
-
139
-
140
-
141
-
142
-
143
-
144
-
145
-
146
-
147
-
148
-
149
-
150
-
151
-
152
-
153
-
154
-
155
-
156
-
157
-
158
-
159
-
160
-
161
-
162
-
163
-
164
 |
 |

management, as well as a significant increase in our individual Medicare stand-alone PDP membership
in 2011 that carries a lower benefit ratio, partially offset by lower favorable prior-period medical
claims reserve development in 2011 than in 2010. The Retail segment’s pretax income for 2011
included the beneficial effect of $245 million in favorable prior-period medical claims reserve
development versus $343 million in 2010. This favorable prior-period medical claims reserve
development decreased the Retail segment benefit ratio by approximately 110 basis points in 2011
versus approximately 180 basis points in 2010.
Operating costs
• The Retail segment operating cost ratio of 11.2% for 2011 increased 10 basis points from 11.1% for
2010. The $147 million write-down of deferred acquisition costs in 2010 increased the operating cost
ratio 80 basis points in 2010. Excluding the impact of the write-down of deferred acquisition costs, the
increase in the operating cost ratio year-over-year primarily reflects increased expenses associated with
the Medicare sales season for 2012 offerings which began a month earlier than in the prior year and
staffing necessary to service anticipated Medicare membership additions. Further, a higher percentage
of membership in individual Medicare stand-alone PDP products contributed to the higher operating
cost ratio, in light of the Humana-Walmart plan, first offered in 2011, which carries a higher operating
cost ratio than other Medicare products.
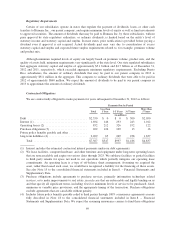
Employer Group Segment
Change
2011 2010 Members Percentage
Membership:
Medical membership:
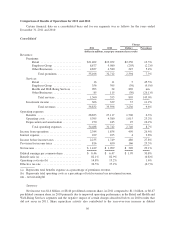
Fully-insured commercial group .......... 1,180,200 1,252,200 (72,000) (5.7)%
ASO ................................ 1,292,300 1,453,600 (161,300) (11.1)%
Group Medicare Advantage .............. 290,600 273,100 17,500 6.4%
Medicare Advantage ASO ............... 27,600 28,200 (600) (2.1)%
Total group Medicare Advantage ..... 318,200 301,300 16,900 5.6%
Group Medicare stand-alone PDP ......... 4,200 2,400 1,800 75.0%
Total group Medicare ............... 322,400 303,700 18,700 6.2%
Total group medical members ........ 2,794,900 3,009,500 (214,600) (7.1)%
Group specialty membership (a) .............. 6,532,600 6,517,500 15,100 0.2%
(a) Specialty products include dental, vision, and other supplemental health and financial protection products.
Members included in these products may not be unique to each product since members have the ability to
enroll in multiple products.
60