Humana 2012 Annual Report Download - page 73
Download and view the complete annual report
Please find page 73 of the 2012 Humana annual report below. You can navigate through the pages in the report by either clicking on the pages listed below, or by using the keyword search tool below to find specific information within the annual report.-
 1
1 -
2
-
3
-
4
-
5
-
6
-
7
-
8
-
9
-
10
-
11
-
12
-
13
-
14
-
15
-
16
-
17
-
18
-
19
-
20
-
21
-
22
-
23
-
24
-
25
-
26
-
27
-
28
-
29
-
30
-
31
-
32
-
33
-
34
-
35
-
36
-
37
-
38
-
39
-
40
-
41
-
42
-
43
-
44
-
45
-
46
-
47
-
48
-
49
-
50
-
51
-
52
-
53
-
54
-
55
-
56
-
57
-
58
-
59
-
60
-
61
-
62
-
 63
63 -
 64
64 -
 65
65 -
 66
66 -
 67
67 -
 68
68 -
 69
69 -
 70
70 -
 71
71 -
 72
72 -
 73
73 -
 74
74 -
 75
75 -
 76
76 -
 77
77 -
 78
78 -
 79
79 -
 80
80 -
 81
81 -
 82
82 -
 83
83 -
84
-
85
-
86
-
87
-
88
-
89
-
90
-
91
-
92
-
93
-
94
-
95
-
96
-
97
-
98
-
99
-
100
-
101
-
102
-
103
-
104
-
105
-
106
-
107
-
108
-
109
-
110
-
111
-
112
-
113
-
114
-
115
-
116
-
117
-
118
-
119
-
120
-
121
-
122
-
123
-
124
-
125
-
126
-
127
-
128
-
129
-
130
-
131
-
132
-
133
-
134
-
135
-
136
-
137
-
138
-
139
-
140
-
141
-
142
-
143
-
144
-
145
-
146
-
147
-
148
-
149
-
150
-
151
-
152
-
153
-
154
-
155
-
156
-
157
-
158
-
159
-
160
-
161
-
162
-
163
-
164
 |
 |

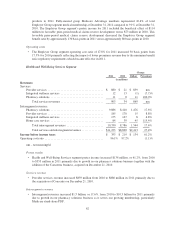
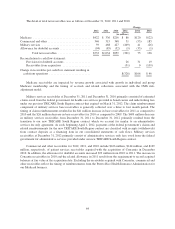
Operating costs
• The Health and Well-Being Services segment operating cost ratio decreased 110 basis points from
2010 to 96.1% for 2011 reflecting scale efficiencies associated with growth in our pharmacy solutions
business together with the addition of our acquired Concentra operations which carry a lower operating
cost ratio than other lines of business in this segment.
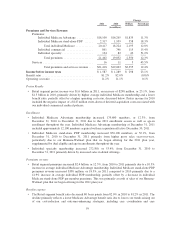
Other Businesses
Pretax income for our Other Businesses of $84 million for 2011 compared to pretax losses of $2 million for
2010. Pretax losses for 2010 include the impact of a net charge of $139 million associated with reserve
strengthening for our closed block of long-term care policies. Excluding this charge, the year-over-year decline
primarily reflects a decrease in pretax income associated with our contract with CMS to administer the LI-NET
program.
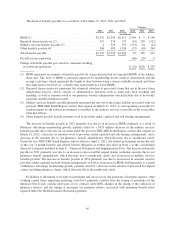
Liquidity
Our primary sources of cash include receipts of premiums, services revenue, and investment and other
income, as well as proceeds from the sale or maturity of our investment securities and borrowings. Our primary
uses of cash include disbursements for claims payments, operating costs, interest on borrowings, taxes, purchases
of investment securities, acquisitions, capital expenditures, repayments on borrowings, dividends, and share
repurchases. Because premiums generally are collected in advance of claim payments by a period of up to several
months, our business normally should produce positive cash flows during periods of increasing premiums and
enrollment. Conversely, cash flows would be negatively impacted during periods of decreasing premiums and
enrollment. From period to period, our cash flows may also be affected by the timing of working capital items.
The use of operating cash flows may be limited by regulatory requirements which require, among other items,
that our regulated subsidiaries maintain minimum levels of capital and seek approval before paying dividends
from the subsidiaries to the parent.
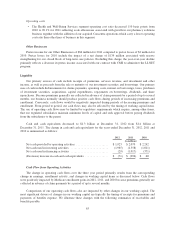
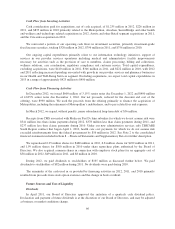
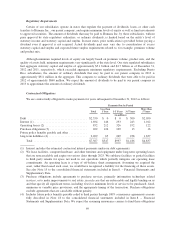
Cash and cash equivalents decreased to $1.3 billion at December 31, 2012 from $1.4 billion at
December 31, 2011. The change in cash and cash equivalents for the years ended December 31, 2012, 2011 and
2010 is summarized as follows:
2012 2011 2010
(in millions)
Net cash provided by operating activities ...................... $1,923 $ 2,079 $ 2,242
Net cash used in investing activities .......................... (1,965) (1,358) (1,811)
Net cash used in financing activities .......................... (29) (1,017) (371)
(Decrease) increase in cash and cash equivalents ................ $ (71) $ (296) $ 60
Cash Flow from Operating Activities
The change in operating cash flows over the three year period primarily results from the corresponding
change in earnings, enrollment activity, and changes in working capital items as discussed below. Cash flows
were positively impacted by Medicare enrollment gains in 2012, 2011, and 2010 because premiums generally are
collected in advance of claim payments by a period of up to several months.
Comparisons of our operating cash flows also are impacted by other changes in our working capital. The
most significant drivers of changes in our working capital are typically the timing of receipts for premiums and
payments of benefits expense. We illustrate these changes with the following summaries of receivables and
benefits payable.
63