Humana 2012 Annual Report Download - page 76
Download and view the complete annual report
Please find page 76 of the 2012 Humana annual report below. You can navigate through the pages in the report by either clicking on the pages listed below, or by using the keyword search tool below to find specific information within the annual report.-
 1
1 -
2
-
3
-
4
-
5
-
6
-
7
-
8
-
9
-
10
-
11
-
12
-
13
-
14
-
15
-
16
-
17
-
18
-
19
-
20
-
21
-
22
-
23
-
24
-
25
-
26
-
27
-
28
-
29
-
30
-
31
-
32
-
33
-
34
-
35
-
36
-
37
-
38
-
39
-
40
-
41
-
42
-
43
-
44
-
45
-
46
-
47
-
48
-
49
-
50
-
51
-
52
-
53
-
54
-
55
-
56
-
57
-
58
-
59
-
60
-
61
-
62
-
63
-
64
-
65
-
 66
66 -
 67
67 -
 68
68 -
 69
69 -
 70
70 -
 71
71 -
 72
72 -
 73
73 -
 74
74 -
 75
75 -
 76
76 -
 77
77 -
 78
78 -
 79
79 -
 80
80 -
 81
81 -
 82
82 -
 83
83 -
 84
84 -
 85
85 -
 86
86 -
87
-
88
-
89
-
90
-
91
-
92
-
93
-
94
-
95
-
96
-
97
-
98
-
99
-
100
-
101
-
102
-
103
-
104
-
105
-
106
-
107
-
108
-
109
-
110
-
111
-
112
-
113
-
114
-
115
-
116
-
117
-
118
-
119
-
120
-
121
-
122
-
123
-
124
-
125
-
126
-
127
-
128
-
129
-
130
-
131
-
132
-
133
-
134
-
135
-
136
-
137
-
138
-
139
-
140
-
141
-
142
-
143
-
144
-
145
-
146
-
147
-
148
-
149
-
150
-
151
-
152
-
153
-
154
-
155
-
156
-
157
-
158
-
159
-
160
-
161
-
162
-
163
-
164
 |
 |
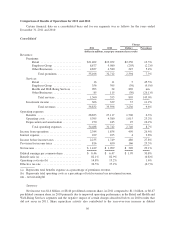
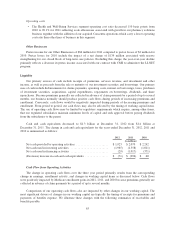
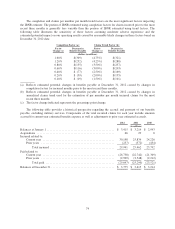
Cash Flow from Investing Activities
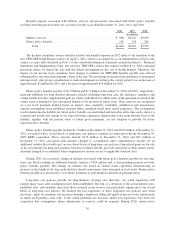
Cash consideration paid for acquisitions, net of cash acquired, of $1,235 million in 2012, $226 million in
2011, and $833 million in 2010 primarily related to the Metropolitan, Arcadian, SeniorBridge and other health
and wellness and technology related acquisitions in 2012, Anvita and other Retail segment acquisitions in 2011,
and the Concentra acquisition in 2010.
We reinvested a portion of our operating cash flows in investment securities, primarily investment-grade
fixed income securities, totaling $320 million in 2012, $796 million in 2011, and $756 million in 2010.
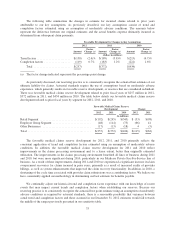
Our ongoing capital expenditures primarily relate to our information technology initiatives, support of
services in our provider services operations including medical and administrative facility improvements
necessary for activities such as the provision of care to members, claims processing, billing and collections,
wellness solutions, care coordination, regulatory compliance and customer service. Total capital expenditures,
excluding acquisitions, were $410 million in 2012, $346 million in 2011, and $222 million in 2010, with 2012
and 2011 reflecting increased spending associated with growth in our provider services and pharmacy businesses
in our Health and Well-Being Services segment. Excluding acquisitions, we expect total capital expenditures in
2013 in a range of approximately $425 million to $450 million.
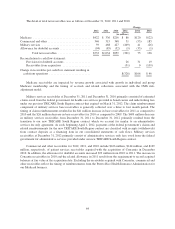
Cash Flow from Financing Activities
In December 2012, we issued $600 million of 3.15% senior notes due December 1, 2022 and $400 million
of 4.625% senior notes due December 1, 2042. Our net proceeds, reduced for the discount and cost of the
offering, were $990 million. We used the proceeds from the offering primarily to finance the acquisition of
Metropolitan, including the retirement of Metropolitan’s indebtedness, and to pay related fees and expenses.
In March 2012, we repaid, without penalty, junior subordinated long-term debt of $36 million.
Receipts from CMS associated with Medicare Part D claim subsidies for which we do not assume risk were
$341 million less than claims payments during 2012, $378 million less than claim payments during 2011, and
$237 million less than claims payments during 2010. Under our new administrative services only TRICARE
South Region contract that began April 1, 2012, health care cost payments for which we do not assume risk
exceeded reimbursements from the federal government by $56 million in 2012. See Note 2 to the consolidated
financial statements included in Item 8. – Financial Statements and Supplementary Data for further description.
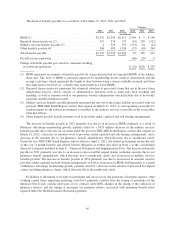
We repurchased 6.25 million shares for $460 million in 2012, 6.8 million shares for $492 million in 2011,
and 1.99 million shares for $100 million in 2010 under share repurchase plans authorized by the Board of
Directors. We also acquired common shares in connection with employee stock plans for an aggregate cost of
$58 million in 2012, $49 million in 2011, and $8 million in 2010.
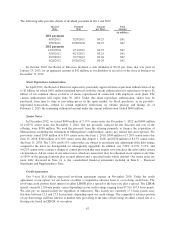
During 2012, we paid dividends to stockholders of $165 million as discussed further below. We paid
dividends to stockholders of $82 million during 2011. No dividends were paid during 2010.
The remainder of the cash used in or provided by financing activities in 2012, 2011, and 2010 primarily
resulted from proceeds from stock option exercises and the change in book overdraft.
Future Sources and Uses of Liquidity
Dividends
In April 2011, our Board of Directors approved the initiation of a quarterly cash dividend policy.
Declaration and payment of future dividends is at the discretion of our Board of Directors, and may be adjusted
as business or market conditions change.
66