Humana 2012 Annual Report Download - page 156
Download and view the complete annual report
Please find page 156 of the 2012 Humana annual report below. You can navigate through the pages in the report by either clicking on the pages listed below, or by using the keyword search tool below to find specific information within the annual report.-
 1
1 -
2
-
3
-
4
-
5
-
6
-
7
-
8
-
9
-
10
-
11
-
12
-
13
-
14
-
15
-
16
-
17
-
18
-
19
-
20
-
21
-
22
-
23
-
24
-
25
-
26
-
27
-
28
-
29
-
30
-
31
-
32
-
33
-
34
-
35
-
36
-
37
-
38
-
39
-
40
-
41
-
42
-
43
-
44
-
45
-
46
-
47
-
48
-
49
-
50
-
51
-
52
-
53
-
54
-
55
-
56
-
57
-
58
-
59
-
60
-
61
-
62
-
63
-
64
-
65
-
66
-
67
-
68
-
69
-
70
-
71
-
72
-
73
-
74
-
75
-
76
-
77
-
78
-
79
-
80
-
81
-
82
-
83
-
84
-
85
-
86
-
87
-
88
-
89
-
90
-
91
-
92
-
93
-
94
-
95
-
96
-
97
-
98
-
99
-
100
-
101
-
102
-
103
-
104
-
105
-
106
-
107
-
108
-
109
-
110
-
111
-
112
-
113
-
114
-
115
-
116
-
117
-
118
-
119
-
120
-
121
-
122
-
123
-
124
-
125
-
126
-
127
-
128
-
129
-
130
-
131
-
132
-
133
-
134
-
135
-
136
-
137
-
138
-
139
-
140
-
141
-
142
-
143
-
144
-
145
-
 146
146 -
 147
147 -
 148
148 -
 149
149 -
 150
150 -
 151
151 -
 152
152 -
 153
153 -
 154
154 -
 155
155 -
 156
156 -
 157
157 -
 158
158 -
 159
159 -
 160
160 -
 161
161 -
 162
162 -
 163
163 -
 164
164
 |
 |

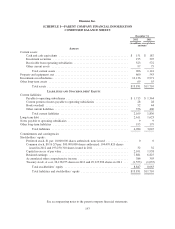
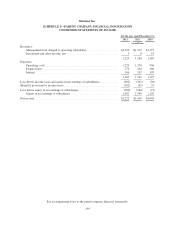
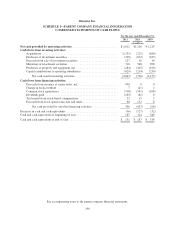
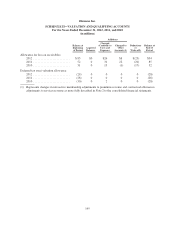
Humana Inc.
SCHEDULE I—PARENT COMPANY FINANCIAL INFORMATION
CONDENSED STATEMENTS OF CASH FLOWS
For the year ended December 31,
2012 2011 2010
(in millions)
Net cash provided by operating activities ............................... $1,611 $1,106 $ 1,219
Cash flows from investing activities:
Acquisitions ................................................... (1,235) (223) (840)
Purchases of investment securities .................................. (338) (632) (633)
Proceeds from sale of investment securities ........................... 127 10 16
Maturities of investment securities .................................. 316 548 698
Purchases of property and equipment, net ............................ (284) (225) (166)
Capital contributions to operating subsidiaries ......................... (629) (214) (230)
Net cash used in investing activities ............................. (2,043) (736) (1,155)
Cash flows from financing activities:
Proceeds from issuance of senior notes, net ........................... 990 0 0
Change in book overdraft ......................................... 7 (21) 2
Common stock repurchases ....................................... (518) (541) (108)
Dividends paid ................................................. (165) (82) 0
Tax benefit from stock-based compensation .......................... 22 15 2
Proceeds from stock option exercises and other ........................ 60 132 8
Net cash provided by (used in) financing activities ................. 396 (497) (96)
Decrease in cash and cash equivalents ................................... (36) (127) (32)
Cash and cash equivalents at beginning of year ............................ 187 314 346
Cash and cash equivalents at end of year ................................. $ 151 $ 187 $ 314
See accompanying notes to the parent company financial statements.
146