Humana 2012 Annual Report Download - page 98
Download and view the complete annual report
Please find page 98 of the 2012 Humana annual report below. You can navigate through the pages in the report by either clicking on the pages listed below, or by using the keyword search tool below to find specific information within the annual report.-
 1
1 -
2
-
3
-
4
-
5
-
6
-
7
-
8
-
9
-
10
-
11
-
12
-
13
-
14
-
15
-
16
-
17
-
18
-
19
-
20
-
21
-
22
-
23
-
24
-
25
-
26
-
27
-
28
-
29
-
30
-
31
-
32
-
33
-
34
-
35
-
36
-
37
-
38
-
39
-
40
-
41
-
42
-
43
-
44
-
45
-
46
-
47
-
48
-
49
-
50
-
51
-
52
-
53
-
54
-
55
-
56
-
57
-
58
-
59
-
60
-
61
-
62
-
63
-
64
-
65
-
66
-
67
-
68
-
69
-
70
-
71
-
72
-
73
-
74
-
75
-
76
-
77
-
78
-
79
-
80
-
81
-
82
-
83
-
84
-
85
-
86
-
87
-
 88
88 -
 89
89 -
 90
90 -
 91
91 -
 92
92 -
 93
93 -
 94
94 -
 95
95 -
 96
96 -
 97
97 -
 98
98 -
 99
99 -
 100
100 -
 101
101 -
 102
102 -
 103
103 -
 104
104 -
 105
105 -
 106
106 -
 107
107 -
 108
108 -
109
-
110
-
111
-
112
-
113
-
114
-
115
-
116
-
117
-
118
-
119
-
120
-
121
-
122
-
123
-
124
-
125
-
126
-
127
-
128
-
129
-
130
-
131
-
132
-
133
-
134
-
135
-
136
-
137
-
138
-
139
-
140
-
141
-
142
-
143
-
144
-
145
-
146
-
147
-
148
-
149
-
150
-
151
-
152
-
153
-
154
-
155
-
156
-
157
-
158
-
159
-
160
-
161
-
162
-
163
-
164
 |
 |

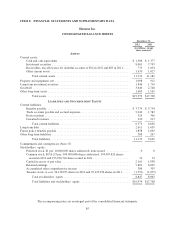
Humana Inc.
CONSOLIDATED STATEMENTS OF STOCKHOLDERS’ EQUITY
Common Stock Capital In
Excess of
Par Value
Retained
Earnings
Accumulated
Other
Comprehensive
Income (Loss)
Treasury
Stock
Total
Stockholders’
Equity
Issued
Shares Amount
(dollars in millions, share amounts in thousands)
Balances, January 1, 2010 ........... 189,801 $32 $1,658 $4,430 $ 42 $ (386) $5,776
Net income ....................... 1,099 1,099
Other comprehensive income ........ 78 78
Common stock repurchases .......... (108) (108)
Stock-based compensation .......... 63 63
Restricted stock grants and restricted
stock unit vesting ................ 5 0 0
Restricted stock forfeitures .......... (127) 0 0 0
Stock option exercises .............. 566 0 17 17
Stock option and restricted stock tax
benefit ........................ (1) (1)
Balances, December 31, 2010 ........ 190,245 32 1,737 5,529 120 (494) 6,924
Net income ....................... 1,419 1,419
Other comprehensive income ........ 183 183
Common stock repurchases .......... (541) (541)
Dividends declared ................ 0 (123) (123)
Stock-based compensation .......... 67 67
Restricted stock grants and restricted
stock unit vesting ................ 11 0 0
Restricted stock forfeitures .......... (105) 0 0 0
Stock option exercises .............. 3,079 0 134 134
Stock option and restricted stock tax
benefit ........................ 0 0
Balances, December 31, 2011 ........ 193,230 32 1,938 6,825 303 (1,035) 8,063
Net income ....................... 1,222 1,222
Other comprehensive income ........ 83 83
Common stock repurchases .......... (518) (518)
Dividends declared ................ 0 (166) (166)
Stock-based compensation .......... 82 82
Restricted stock grants and restricted
stock unit vesting ................ 15 0 0
Restricted stock forfeitures .......... (1) 0 0 0
Stock option exercises .............. 1,227 0 60 60
Stock option and restricted stock tax
benefit ........................ 21 21
Balances, December 31, 2012 ........ 194,471 $32 $2,101 $7,881 $386 $(1,553) $8,847
The accompanying notes are an integral part of the consolidated financial statements.
88