Humana 2012 Annual Report Download - page 85
Download and view the complete annual report
Please find page 85 of the 2012 Humana annual report below. You can navigate through the pages in the report by either clicking on the pages listed below, or by using the keyword search tool below to find specific information within the annual report.-
 1
1 -
2
-
3
-
4
-
5
-
6
-
7
-
8
-
9
-
10
-
11
-
12
-
13
-
14
-
15
-
16
-
17
-
18
-
19
-
20
-
21
-
22
-
23
-
24
-
25
-
26
-
27
-
28
-
29
-
30
-
31
-
32
-
33
-
34
-
35
-
36
-
37
-
38
-
39
-
40
-
41
-
42
-
43
-
44
-
45
-
46
-
47
-
48
-
49
-
50
-
51
-
52
-
53
-
54
-
55
-
56
-
57
-
58
-
59
-
60
-
61
-
62
-
63
-
64
-
65
-
66
-
67
-
68
-
69
-
70
-
71
-
72
-
73
-
74
-
 75
75 -
 76
76 -
 77
77 -
 78
78 -
 79
79 -
 80
80 -
 81
81 -
 82
82 -
 83
83 -
 84
84 -
 85
85 -
 86
86 -
 87
87 -
 88
88 -
 89
89 -
 90
90 -
 91
91 -
 92
92 -
 93
93 -
 94
94 -
 95
95 -
96
-
97
-
98
-
99
-
100
-
101
-
102
-
103
-
104
-
105
-
106
-
107
-
108
-
109
-
110
-
111
-
112
-
113
-
114
-
115
-
116
-
117
-
118
-
119
-
120
-
121
-
122
-
123
-
124
-
125
-
126
-
127
-
128
-
129
-
130
-
131
-
132
-
133
-
134
-
135
-
136
-
137
-
138
-
139
-
140
-
141
-
142
-
143
-
144
-
145
-
146
-
147
-
148
-
149
-
150
-
151
-
152
-
153
-
154
-
155
-
156
-
157
-
158
-
159
-
160
-
161
-
162
-
163
-
164
 |
 |

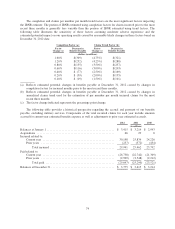
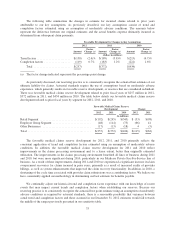
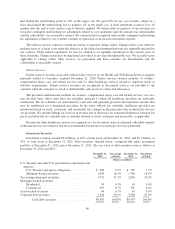
The following table summarizes the changes in estimate for incurred claims related to prior years
attributable to our key assumptions. As previously described, our key assumptions consist of trend and
completion factors estimated using an assumption of moderately adverse conditions. The amounts below
represent the difference between our original estimates and the actual benefits expense ultimately incurred as
determined from subsequent claim payments.
Favorable Development by Changes in Key Assumptions
2012 2011 2010
Amount
Factor
Change (a) Amount
Factor
Change (a) Amount
Factor
Change (a)
(dollars in millions)
Trend factors ....................... $(138) (2.4)% $(189) (3.8)% $(213) (4.7)%
Completion factors .................. (119) 0.7% (183) 1.2% (221) 1.6%
Total ......................... $(257) $(372) $(434)
(a) The factor change indicated represents the percentage point change.
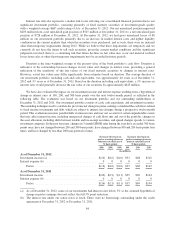
As previously discussed, our reserving practice is to consistently recognize the actuarial best estimate of our
ultimate liability for claims. Actuarial standards require the use of assumptions based on moderately adverse
experience, which generally results in favorable reserve development, or reserves that are considered redundant.
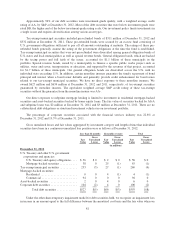
There was favorable medical claims reserve development related to prior fiscal years of $257 million in 2012,
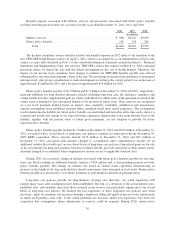
$372 million in 2011, and $434 million in 2010. The table below details our favorable medical claims reserve
development related to prior fiscal years by segment for 2012, 2011, and 2010.
Favorable Medical Claims Reserve
Development Change
2012 2011 2010 2012 2011
(in millions)
Retail Segment ................................... $(192) $(245) $(343) $ (53) $(98)
Employer Group Segment .......................... (48) (114) (73) (66) 41
Other Businesses ................................. (17) (13) (18) 4 (5)
Total ........................................... $(257) $(372) $(434) $(115) $(62)
The favorable medical claims reserve development for 2012, 2011, and 2010 primarily reflects the
consistent application of trend and completion factors estimated using an assumption of moderately adverse
conditions. In addition, the favorable medical claims reserve development for 2011 and 2010 reflect
improvements in the claims processing environment and, to a lesser extent, better than originally estimated
utilization. The improvements in the claims processing environment benefited all lines of business during 2011
and 2010, but were more significant during 2010, particularly in our Medicare Private Fee-For-Service line of
business. As a result of these improvements, during 2011 and 2010 we experienced a significant increase in claim
overpayment recoveries for claims incurred in prior years, primarily as a result of increased audits of provider
billings, as well as system enhancements that improved the claim recovery functionality. In addition, in 2010, a
shortening of the cycle time associated with provider claim submissions was a contributing factor. We believe we
have consistently applied our methodology in determining our best estimate for benefits payable.
We continually adjust our historical trend and completion factor experience with our knowledge of recent
events that may impact current trends and completion factors when establishing our reserves. Because our
reserving practice is to consistently recognize the actuarial best point estimate using an assumption of moderately
adverse conditions as required by actuarial standards, there is a reasonable possibility that variances between
actual trend and completion factors and those assumed in our December 31, 2012 estimates would fall towards
the middle of the ranges previously presented in our sensitivity table.
75