Humana 2012 Annual Report Download - page 64
Download and view the complete annual report
Please find page 64 of the 2012 Humana annual report below. You can navigate through the pages in the report by either clicking on the pages listed below, or by using the keyword search tool below to find specific information within the annual report.-
 1
1 -
2
-
3
-
4
-
5
-
6
-
7
-
8
-
9
-
10
-
11
-
12
-
13
-
14
-
15
-
16
-
17
-
18
-
19
-
20
-
21
-
22
-
23
-
24
-
25
-
26
-
27
-
28
-
29
-
30
-
31
-
32
-
33
-
34
-
35
-
36
-
37
-
38
-
39
-
40
-
41
-
42
-
43
-
44
-
45
-
46
-
47
-
48
-
49
-
50
-
51
-
52
-
53
-
 54
54 -
 55
55 -
 56
56 -
 57
57 -
 58
58 -
 59
59 -
 60
60 -
 61
61 -
 62
62 -
 63
63 -
 64
64 -
 65
65 -
 66
66 -
 67
67 -
 68
68 -
 69
69 -
 70
70 -
 71
71 -
 72
72 -
 73
73 -
 74
74 -
75
-
76
-
77
-
78
-
79
-
80
-
81
-
82
-
83
-
84
-
85
-
86
-
87
-
88
-
89
-
90
-
91
-
92
-
93
-
94
-
95
-
96
-
97
-
98
-
99
-
100
-
101
-
102
-
103
-
104
-
105
-
106
-
107
-
108
-
109
-
110
-
111
-
112
-
113
-
114
-
115
-
116
-
117
-
118
-
119
-
120
-
121
-
122
-
123
-
124
-
125
-
126
-
127
-
128
-
129
-
130
-
131
-
132
-
133
-
134
-
135
-
136
-
137
-
138
-
139
-
140
-
141
-
142
-
143
-
144
-
145
-
146
-
147
-
148
-
149
-
150
-
151
-
152
-
153
-
154
-
155
-
156
-
157
-
158
-
159
-
160
-
161
-
162
-
163
-
164
 |
 |

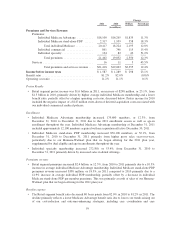
Benefits expense
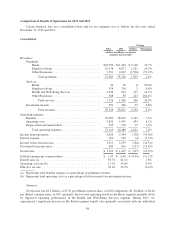
• The Employer Group segment benefit ratio of 84.1% for 2012 increased 170 basis points from 82.4%
in 2011 primarily due to higher membership in our group Medicare Advantage products which
generally carry a higher benefit ratio than our fully-insured commercial group products. In addition,
year-over-year comparisons of the benefit ratio were negatively impacted by lower favorable prior-
period medical claims reserve development in 2012 than in 2011. These increases were partially offset
by the beneficial effect on the benefit ratio in 2012 of a reduction in prior-year premium rebate
estimates discussed above. Fully-insured group Medicare Advantage members represented 13.0% of
total Employer Group segment medical membership at December 31, 2012 compared to 10.4% at
December 31, 2011. The Employer Group segment’s pretax income for 2012 included the beneficial
effect of $48 million in favorable prior-period medical claims reserve development versus $114 million
in 2011. This favorable prior-period medical claims reserve development decreased the Employer
Group segment benefit ratio by approximately 50 basis points in 2012 versus approximately 130 basis
points in 2011.
Operating costs
• The Employer Group segment operating cost ratio of 16.1% for 2012 improved 170 basis points from
17.8% for 2011 primarily reflecting growth in our group Medicare Advantage products which
generally carry a lower operating cost ratio than our fully-insured commercial group products and
continued savings as a result of our operating cost reduction initiatives.
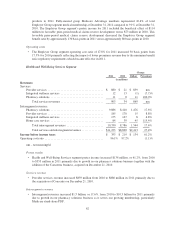
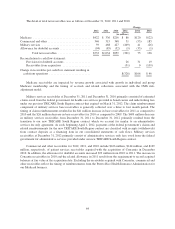
Health and Well-Being Services Segment
Change
2012 2011 Dollars Percentage
(in millions)
Revenues:
Services:
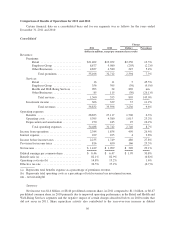
Provider services ..................................... $ 967 $ 880 $ 87 9.9%
Home care services ................................... 40 0 40 100.0%
Pharmacy solutions ................................... 16 11 5 45.5%
Integrated wellness services ............................ 13 12 1 8.3%
Total services revenues ............................ 1,036 903 133 14.7%
Intersegment revenues:
Pharmacy solutions ................................... 11,352 9,886 1,466 14.8%
Provider services ..................................... 214 185 29 15.7%
Integrated wellness services ............................ 219 175 44 25.1%
Home care services ................................... 167 84 83 98.8%
Total intersegment revenues ........................ 11,952 10,330 1,622 15.7%
Total services and intersegment revenues .............. $12,988 $11,233 $1,755 15.6%
Income before income taxes $ 486 $ 353 $ 133 37.7%
Operating cost ratio ....................................... 95.5% 96.1% (0.6)%
Pretax results
• Health and Well-Being Services segment pretax income increased $133 million, or 37.7%, from 2011
to $486 million in 2012 primarily due to growth in our pharmacy solutions business, including higher
utilization of our mail-order pharmacy by our members.
54