Humana 2012 Annual Report Download - page 60
Download and view the complete annual report
Please find page 60 of the 2012 Humana annual report below. You can navigate through the pages in the report by either clicking on the pages listed below, or by using the keyword search tool below to find specific information within the annual report.-
 1
1 -
2
-
3
-
4
-
5
-
6
-
7
-
8
-
9
-
10
-
11
-
12
-
13
-
14
-
15
-
16
-
17
-
18
-
19
-
20
-
21
-
22
-
23
-
24
-
25
-
26
-
27
-
28
-
29
-
30
-
31
-
32
-
33
-
34
-
35
-
36
-
37
-
38
-
39
-
40
-
41
-
42
-
43
-
44
-
45
-
46
-
47
-
48
-
49
-
 50
50 -
 51
51 -
 52
52 -
 53
53 -
 54
54 -
 55
55 -
 56
56 -
 57
57 -
 58
58 -
 59
59 -
 60
60 -
 61
61 -
 62
62 -
 63
63 -
 64
64 -
 65
65 -
 66
66 -
 67
67 -
 68
68 -
 69
69 -
 70
70 -
71
-
72
-
73
-
74
-
75
-
76
-
77
-
78
-
79
-
80
-
81
-
82
-
83
-
84
-
85
-
86
-
87
-
88
-
89
-
90
-
91
-
92
-
93
-
94
-
95
-
96
-
97
-
98
-
99
-
100
-
101
-
102
-
103
-
104
-
105
-
106
-
107
-
108
-
109
-
110
-
111
-
112
-
113
-
114
-
115
-
116
-
117
-
118
-
119
-
120
-
121
-
122
-
123
-
124
-
125
-
126
-
127
-
128
-
129
-
130
-
131
-
132
-
133
-
134
-
135
-
136
-
137
-
138
-
139
-
140
-
141
-
142
-
143
-
144
-
145
-
146
-
147
-
148
-
149
-
150
-
151
-
152
-
153
-
154
-
155
-
156
-
157
-
158
-
159
-
160
-
161
-
162
-
163
-
164
 |
 |

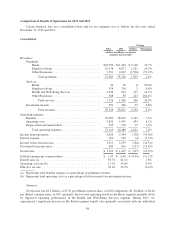
described further in our segment results discussion that follows. The $115 million decline in favorable prior-
period medical claims reserve development from 2011 to 2012 negatively impacted year-over-year comparisons
of the benefit ratio. Year-over-year comparisons of the consolidated benefit ratio were favorably impacted by 20
basis points due to the continued growth of our Health & Well-Being Services segment and the related savings
realized on a consolidated basis from providing these services directly to our members at fair market value rather
than through a third party.
Operating Costs
Our segments incur both direct and shared indirect operating costs. We allocate the indirect costs shared by
the segments primarily as a function of revenues. As a result, the profitability of each segment is interdependent.
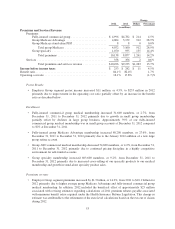
Consolidated operating costs increased $435 million, or 8.1%, during 2012 compared to 2011, primarily due
an increase in operating costs in our Retail Segment as a result of Medicare Advantage growth.
The consolidated operating cost ratio for 2012 was 15.1%, increasing 30 basis points from the 2011
operating cost ratio of 14.8% as the negative impact of the new TRICARE South Region contract being
accounted for as an administrative services fee only arrangement was partially offset by improved operating
leverage.
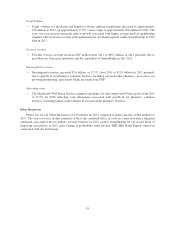
Depreciation and Amortization
Depreciation and amortization for 2012 totaled $295 million, an increase of $25 million, or 9.3%, from
2011, primarily reflecting depreciation and amortization expense associated with the acquisitions of Anvita in the
fourth quarter of 2011, Arcadian in the first quarter of 2012, SeniorBridge in the third quarter of 2012, and other
health and wellness businesses during 2012.
Interest Expense
Interest expense was $105 million for 2012, compared to $109 million for 2011, a decrease of $4 million, or
3.7%. In March 2012, we repaid $36 million of junior subordinated debt that carried a higher interest rate than
our senior notes. In December 2012, we issued $600 million of 3.15% senior notes due December 1, 2022 and
$400 million of 4.625% senior notes due December 1, 2042.
Income Taxes
Our effective tax rate during 2012 was 36.1% compared to the effective tax rate of 36.5% in 2011. See Note
10 to the consolidated financial statements included in Item 8. – Financial Statements and Supplementary Data
for a complete reconciliation of the federal statutory rate to the effective tax rate.
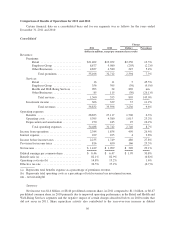
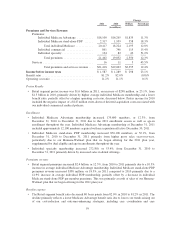
Retail Segment
Change
2012 2011 Members Percentage
Membership:
Medical membership:
Individual Medicare Advantage ....................... 1,927,600 1,640,300 287,300 17.5%
Individual Medicare stand-alone PDP .................. 2,985,600 2,540,400 445,200 17.5%
Total individual Medicare ........................ 4,913,200 4,180,700 732,500 17.5%
Individual commercial .............................. 521,400 493,200 28,200 5.7%
Total individual medical members ................. 5,434,600 4,673,900 760,700 16.3%
Individual specialty membership (a) ........................ 948,700 782,500 166,200 21.2%
50