Bank of America 2003 Annual Report Download - page 15
Download and view the complete annual report
Please find page 15 of the 2003 Bank of America annual report below. You can navigate through the pages in the report by either clicking on the pages listed below, or by using the keyword search tool below to find specific information within the annual report.-
 1
1 -
2
-
3
-
4
-
 5
5 -
 6
6 -
 7
7 -
 8
8 -
 9
9 -
 10
10 -
 11
11 -
 12
12 -
 13
13 -
 14
14 -
 15
15 -
 16
16 -
 17
17 -
 18
18 -
 19
19 -
 20
20 -
 21
21 -
 22
22 -
 23
23 -
 24
24 -
 25
25 -
26
-
27
-
28
-
29
-
30
-
31
-
32
-
33
-
34
-
35
-
36
-
37
-
38
-
39
-
40
-
41
-
42
-
43
-
44
-
45
-
46
-
47
-
48
-
49
-
50
-
51
-
52
-
53
-
54
-
55
-
56
-
57
-
58
-
59
-
60
-
61
 |
 |

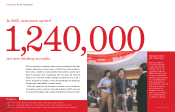
Debit card purchase volumes grew 22 percent while consumer
credit card purchases increased 13 percent in 2003 from 2002. Total
managed consumer credit card revenue, including interest income,
increased 25 percent in 2003. Average managed consumer credit
card receivables grew 15 percent in 2003 due to new account growth
from direct marketing programs and the branch network.
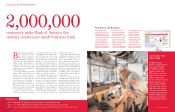
Asse t Manage me nt exceeded its goal of increasing the number
of financial advisors by 20 percent and ended the year with 1,150
financial advisors. The Premier Banking and Investments partnership
has developed an integrated financial services model and as a com-
ponent of the continued strategic distribution channel expansion
opened 10 new wealth centers. In addition, Marsico Capital
Management, LLC’s (Marsico) assets under management more than
doubled to $30.2 billion at December 31, 2003.
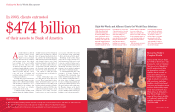
Global Corporate and Inve stme nt Banking maintained market
share in syndicated loans and fixed income areas and gained in areas
such as mergers and acquisitions and mortgage-backed securities.
Continued improvements in credit quality in our large corporate port-
folio drove the $731 million, or 61 percent, decrease in provision for
credit losses in Global Corporate and Inve stme nt Banking. Net charge-
offs in 2003 in the large corporate portfolio were at their lowest lev-
els in three years. In addition, large corporate nonperforming assets
dropped $1.7 billion, or 57 percent.
Financial Highlights
Net interest income on a fully taxable-equivalent basis increased $596
million to $22.1 billion in 2003. This increase was driven by higher
asset and liability management (ALM) portfolio levels (consisting of
securities, whole loan mortgages and derivatives), higher consumer
loan levels, larger trading-related contributions, higher mortgage ware-
house and core deposit funding levels. Partially offsetting these
increases was the impact of lower interest rates and reductions in the
large corporate, foreign and exited consumer loan businesses portfo-
lios. The net interest yield on a fully taxable-equivalent basis declined
39 basis points (bps) to 3.36 percent in 2003 due to the negative
impact of increases in lower-yielding trading-related assets and declin-
ing rates offset partially by our ALM portfolio repositioning.
Noninterest income increased $2.9 billion to $16.4 billion in
2003, due to increases in (i) mortgage banking income of $1.2 billion,
(ii) equity investment gains of $495 million, (iii) other noninterest
income of $485 million, (iv) card income of $432 million and (v) con-
sumer-based fee income of $244 million. The increase in mortgage
banking income was driven by gains from higher volumes of mortgage
loans sold into the secondary market and improved profit margins.
Other noninterest income of $1.1 billion included gains of $772 mil-
lion, an increase of $272 million over 2002, as we sold whole loan
mortgages to manage prepayment risk due to the longer than antici-
pated low interest rate environment. Additionally, other noninterest
income included the equity in the earnings of our investment in Grupo
Financiero Santander Serfin (GFSS) of $122 million.
Gains on sales of debt securities in 2003 and 2002, were $941
million and $630 million, respectively, as we continued to reposition
the ALM portfolio in response to interest rate fluctuations.
The provision for credit losses declined $858 million to $2.8 bil-
lion in 2003 due to an improvement in the commercial portfolio
partially offset by a stable but growing consumer portfolio.
Nonperforming assets decreased $2.2 billion to $3.0 billion, or 0.81
percent of loans, leases and foreclosed properties at December 31,
2003 compared to 1.53 percent at December 31, 2002. This decline
was driven by reduced levels of inflows to nonperforming assets in
Global Corporate and Inve stme nt Banking,together with loan sales and
payoffs facilitated by high levels of liquidity in the capital markets.
Noninterest expense increased $1.7 billion in 2003 from 2002,
driven by higher personnel costs, increased professional fees includ-
ing legal expense and increased marketing expense. Higher personnel
costs resulted from increased costs of employee benefits of $504
million and revenue-related incentives of $435 million. Employee ben-
efits expense increased due to stock option expense of $120 million
in 2003 and the impacts of a change in the expected long-term rates
of return on plan assets to 8.5 percent for 2003 from 9.5 percent in
2002 and a change in the discount rate to 6.75 percent in 2003 from
7.25 percent in 2002 for the Bank of America Pension Plan. The
increase in professional fees of $319 million was driven by an
increase in litigation accruals of $220 million associated with pend-
ing litigation principally related to securities matters. Marketing
expense increased by $232 million due to higher advertising costs,
as well as marketing investments in direct marketing for the credit
card business. In addition, recorded in other expense during the third
quarter of 2003 was a $100 million charge related to issues sur-
rounding our mutual fund practices.
Income tax expense was $5.1 billion reflecting an effective tax
rate of 31.8 percent in 2003 compared to $3.7 billion and 28.8 per-
cent in 2002, respectively. The 2002 effective tax rate was impacted
by a $488 million reduction in income tax expense resulting from a
settlement with the IRS generally covering tax years ranging from
1984 to 1999 but including tax returns as far back as 1971.
The result of the above was a 17 percent growth in net income
in 2003 compared to 2002. Management does not currently expect
that this level of growth will recur in 2004.
FleetBoston Merger
On October 27, 2003, we announced a definitive agreement to merge
with FleetBoston Financial Corporation (FleetBoston). The merger is
expected to create a banking institution with a truly national scope,
with an increased presence in America’s growth and wealth markets
and leading market shares throughout the Northeast, Southeast,
Southwest, Midwest and West regions of the United States. The
merger will be a stock-for-stock transaction with a purchase price
currently estimated to be approximately $46.0 billion. Each share of
FleetBoston common stock will be exchanged for 0.5553 of a share
of our common stock, resulting in the issuance of approximately 600
million shares of our common stock. FleetBoston shareholders will
receive cash instead of any fractional shares of our common stock
that would have otherwise been issued at the completion of the merger.
The agreement has been approved by both boards of directors and is
subject to customary regulatory and shareholder approvals. The clos-
ing is expected in April of 2004. At the time of the merger announce-
ment, we anticipated repurchasing approximately 67 million shares
through 2004 and 23 million shares in 2005, net of option exercises,
as a result of the merger. The effect on our liquidity of this transac-
tion is expected to be minimal.
In connection with the merger, we have been developing a plan
to integrate our operations with FleetBoston’s. The integration costs
have been estimated to be $800 million after-tax, or $1.3 billion
pre-tax. The specific details of this plan will continue to be refined
over the next several months.
Fourth Quarter 2003 Results
Net income totaled $2.7 billion, or $1.83 per diluted common share
for the fourth quarter of 2003. The return on average common share-
holders’ equity was 22 percent for the three months ended
December 31, 2003. Total revenue on a fully taxable-equivalent basis
was $9.8 billion. Fully taxable-equivalent net interest income
increased $268 million to $5.7 billion from third quarter 2003 levels
due to the impact of interest rates, higher ALM portfolio levels and
higher levels of consumer loans offset by lower mortgage warehouse
levels. Mortgage banking income decreased to $292 million in the
fourth quarter from $666 million in the third quarter of 2003 due to
lower levels of refinancing production. Equity investment gains were
$215 million in the fourth quarter of 2003 due to $212 million in
gains from securities sold that were received in satisfaction of debt
that had been restructured and charged off in prior periods. Trading-
related results were negatively impacted as we marked down the
value of our derivative exposure by $92 million relating to Parmalat
Finanziera SpA and its related entities (Parmalat). For additional infor-
mation on our exposure to Parmalat see “Credit Quality Performance”
beginning on page 46. Gains recognized in our whole mortgage loan
portfolio were $48 million in the fourth quarter of 2003 compared to
$197 million in the third quarter of 2003. During the quarter, we gen-
erated $139 million in gains on sales of debt securities compared to
$233 million in the third quarter of 2003. The income tax rate
decreased from 31.3 percent in the third quarter of 2003 to 30.2
percent in the fourth quarter of 2003 due to adjustments related to
our normal tax accrual review, tax refunds received and reductions in
previously accrued taxes.
26 BANK OF AMERICA 2003 BANK OF AMERICA 2003 27
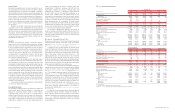
Table 1
Five-Year Summary of Selected Financial Data(1)
(Dollars in millions, except per share information)
2003 2002 2001 2000 1999
Income statement
Net interest income
$21,464 $20,923 $ 20,290 $ 18,349 $ 18,127
Noninterest income
16,422 13,571 14,348 14,582 14,179
Total revenue
37,886 34,494 34,638 32,931 32,306
Provision for credit losses
2,839 3,697 4,287 2,535 1,820
Gains on sales of debt securities
941 630 475 25 240
Noninterest expense
20,127 18,436 20,709 18,633 18,511
Income before income taxes
15,861 12,991 10,117 11,788 12,215
Income tax expense
5,051 3,742 3,325 4,271 4,333
Net income
10,810 9,249 6,792 7,517 7,882
Average common shares issued and outstanding (in thousands)
1,486,703 1,520,042 1,594,957 1,646,398 1,726,0
06
Average diluted common shares issued and outstanding (in thousands)
1,515,178 1,565,467 1,625,654 1,664,929 1,760,0
58
Performance ratios
Return on average assets
1.41% 1.40% 1.04% 1.12% 1.28
%
Return on average common shareholders’ equity
21.99 19.44 13.96 15.96 16.93
Total equity to total assets (at year end)
6.52 7.61 7.80 7.41 7.02
Total average equity to total average assets
6.44 7.18 7.49 7.01 7.55
Dividend payout
39.58 40.07 53.44 45.02 40.54
Per common share data
Earnings
$7.27 $6.08 $ 4.26 $ 4.56 $ 4.56
Diluted earnings
7.13 5.91 4.18 4.52 4.48
Dividends paid
2.88 2.44 2.28 2.06 1.85
Book value
33.26
33.
49 31.07 29.47 26.44
Average balance sheet
Total loans and leases
$356,148 $336,819 $ 365,447 $ 392,622 $ 362,783
Total assets
764,132 662,943 650,083 672,067 617,352
Total deposits
406,233 371,479 362,653 353,294 341,748
Long-term debt(2)
68,432 66,045 69,622 70,293 57,574
Common shareholders’ equity
49,148 47,552 48,609 47,057 46,527
Total shareholders’ equity
49,204 47,613 48,678 47,132 46,601
Capital ratios (at year end)
Risk-based capital:
Tier 1 capital
7.85% 8.22% 8.30% 7.50% 7.35
%
Total capital
11.87 12.43 12.67 11.04 10.88
Leverage
5.73 6.29 6.55 6.11 6.26
Market price per share of common stock
Closing
$80.43 $69.57 $ 62.95 $ 45.88 $ 50.19
High closing
83.53 76.90 65.00 59.25 75.50
Low closing
65.63 54.15 46.75 38.00 48.00
(1) As a result of the adoption of Statement of Financial Accounting Standards (SFAS) No. 142 “Goodwill and Other Intangible Assets” (SFAS 142) on January 1, 2002, the Corporation no longer amortizes
goodwill. Goodwill amortization expense was $662, $635 and $635 in 2001, 2000 and 1999, respectively.
(2) Includes long-term debt related to trust preferred securities (Trust Securities).