Bank of America 2003 Annual Report Download - page 21
Download and view the complete annual report
Please find page 21 of the 2003 Bank of America annual report below. You can navigate through the pages in the report by either clicking on the pages listed below, or by using the keyword search tool below to find specific information within the annual report.-
 1
1 -
2
-
3
-
4
-
5
-
6
-
7
-
8
-
9
-
10
-
 11
11 -
 12
12 -
 13
13 -
 14
14 -
 15
15 -
 16
16 -
 17
17 -
 18
18 -
 19
19 -
 20
20 -
 21
21 -
 22
22 -
 23
23 -
 24
24 -
 25
25 -
 26
26 -
 27
27 -
 28
28 -
 29
29 -
 30
30 -
 31
31 -
32
-
33
-
34
-
35
-
36
-
37
-
38
-
39
-
40
-
41
-
42
-
43
-
44
-
45
-
46
-
47
-
48
-
49
-
50
-
51
-
52
-
53
-
54
-
55
-
56
-
57
-
58
-
59
-
60
-
61
 |
 |

Equity Investments
Equity Inve stme nts includes Principal Inve sting and our strategic
alliances and investment portfolio. Principal Inve sting is comprised of
a diversified portfolio of investments in privately-held and publicly-
traded companies at all stages, from start-up to buyout. Investments
are made on both a direct and indirect basis in the U.S. and over-
seas. Indirect investments represent passive limited partnership
commitments to funds managed by experienced third party private
equity investors who act as general partners.
In 2003, revenue increased $192 million, or 43 percent, due to
an improvement in equity investment gains. Equity Inve stme nts had a
net loss of $249 million in 2003 compared to a net loss of $331 mil-
lion in 2002. The improvement was primarily due to lower impair-
ments. SVA increased by $108 million, or 19 percent, due to the
improvement in the net loss, lower capital levels and the reduction in
the rate used to calculate the charge for the use of capital.
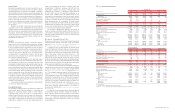
The following table presents the equity investment portfolio in
Principal Inve sting by major industry.
Equity Investments in the Principal Investing Portfolio
December 31
(Dollars in millions)
2003 2002
Consumer discretionary
$1,435 $1,311
Industrials
876 999
Information technology
741 830
Telecommunication services
639 673
Health care
385 397
Financials
332 266
Materials
266 337
Consumer staples
245 276
Real estate
229 236
Individual trusts, nonprofits, government
48 79
Utilities
35 22
Energy
29 29
Total
$5,260 $5,455
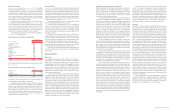
The following table presents the equity investment gains (losses) in
Principal Inve sting.
Equity Investment Gains (Losses) in Principal Investing
(Dollars in millions)
2003 2002
Cash gains
$273 $432
Impairments
(438) (708)
Fair value adjustments
47 (10)
Total
$(118) $(286)
Net interest income consists primarily of the internal funding cost
associated with the carrying value of investments.
Noninterest income primarily consists of equity investment
gains (losses). While overall economic conditions in 2003 improved,
leading to lower impairment charges of $438 million in 2003 com-
pared to $708 million in 2002, weakness in the private equity mar-
kets remained. This weakness resulted in a reduced level of cash
gains in 2003 as compared to 2002. We anticipate that, with a con-
tinued improvement in the economy, cash gains should increase and
impairments should continue to decline.
Corporate Other
Corporate Othe r consists primarily of certain results associated with
our ALM process and certain consumer finance and commercial lend-
ing businesses that are being liquidated. Beginning in the first quar-
ter of 2003, net interest income from certain results associated with
our ALM process was allocated directly to the business units. Prior
periods have been restated to reflect this change in methodology. In
addition, compensation expense related to stock-based employee
compensation plans is included in Corporate Othe r.
Total revenue increased $56 million, or seven percent, in 2003.
Net income decreased $245 million, or 22 percent.
Net interest income decreased $204 million, or 22 percent, pri-
marily due to the continued run-off of certain consumer finance and
commercial lending businesses that are being liquidated. Average
loans and leases increased $27.8 billion, or 42 percent, in 2003,
due to the ALM process. Average deposits increased $2.9 billion, or
25 percent, in 2003.
Noninterest income increased $260 million to $195 million in
2003, resulting from increases in gains on whole loan sales. Gains
on whole loan sales increased $272 million to $772 million resulting
from sales of whole loan mortgages used to manage prepayment risk
due to the longer than anticipated low interest rate environment.
Gains on sales of debt securities in 2003 and 2002, were $943
million and $682 million, respectively, as we continued to reposition
the ALM portfolio in response to changes in interest rates.
Noninterest expense increased $174 million, or 56 percent, due
to a $187 million increase in professional fees resulting from litiga-
tion expenses.
Managing Risk
Overview
Our management governance structure enables us to manage all
major aspects of our business through an integrated planning and
review process that includes strategic, financial, associate and risk
planning. We derive much of our revenue from managing risk from cus-
tomer transactions for profit. Through our management governance
structure, risk and return are evaluated with a goal of producing sus-
tainable revenue, reducing earnings volatility and increasing share-
holder value. Our business exposes us to four major risks: liquidity,
credit, market and operational.
Liquidity risk is the inability to accommodate liability maturities
and deposit withdrawals, fund asset growth and meet contractual
obligations through unconstrained access to funding at reasonable
market rates. Credit risk is the risk of loss arising from customer or
counterparty’s inability to meet its obligation and exists in our out-
standing loans and leases, trading account assets, derivative assets
and unfunded lending commitments that include loan commitments,
letters of credit and financial guarantees. Market risk is the potential
loss due to adverse changes in the market value or yield of a posi-
tion. Market value is defined as the value at which positions could be
sold in a transaction with a willing and knowledgeable counterparty.
Operational risk is the potential for loss resulting from events involv-
ing people, processes, technology, external events, execution, legal,
compliance and regulatory matters, and reputation.
Risk Management Processes and Methods
We have established control processes and use various methods to
align risk-taking and risk management throughout our organization.
These control processes and methods are designed around “three
lines of defense”: lines of business; Risk Management (including
Compliance) joined by other support units such as Finance,
Personnel and Legal; and Corporate Audit.
Our business segments each contain lines of business that are
responsible for identifying, quantifying, mitigating and managing all
risks. Except for trading-related business activities, interest rate risk
associated with our business activities is managed centrally in the
Corporate Treasury function. Lines of business management make
and execute the business plan and are closest to the changing
nature of risks and, therefore, we believe are best able to take
actions to manage and mitigate those risks. Our management
processes, structures and policies aid us in complying with laws and
regulations and provide clear lines for decision-making and account-
ability. Wherever practical, we attempt to house decision-making
authority as close to the customer as possible while retaining super-
visory control functions outside of the lines of business.
The Risk Management organization translates approved busi-
ness plans into approved limits, approves requests for changes to
those limits, approves transactions as appropriate, and works closely
with business units to establish and monitor risk parameters.
Risk Management has assigned a Risk Executive to each of the four
business segments who is responsible for oversight for all risks asso-
ciated with that business segment.
Corporate Audit provides an independent assessment of our
management and internal control systems. Corporate Audit activities
are designed to provide reasonable assurance that resources are
adequately protected; significant financial, managerial and operating
information is materially complete, accurate and reliable; and employ-
ees’ actions are in compliance with corporate policies, standards,
procedures, and applicable laws and regulations.
We use various methods to manage risks at the line of business
levels and corporate-wide. Examples of these methods include plan-
ning and forecasting, risk committees and forums, limits, models, and
hedging strategies. Planning and forecasting facilitates analysis of
actual versus planned results and provides an indication of unantici-
pated risk levels. Generally, risk committees and forums are com-
prised of lines of business, risk management, legal and finance
personnel, among others, and actively monitor performance against
plan, limits and potential issues. Limits, the amount of exposure that
may be taken in a product, relationship, region or industry, are set
based on metrics thereby seeking to align risk goals with those of
each line of business and are part of our overall risk management
process to help reduce the volatility of market, credit and operational
losses. Models are used to estimate market value and net interest
income sensitivity, and to estimate both expected and unexpected
losses for each product and line of business. Hedging strategies are
used to improve concentrations of credit risk to specific counterpar-
ties and to manage interest rate, foreign exchange and market risk in
the portfolio.
The formal processes used to manage risk represent only one
portion of our overall risk management process. Corporate culture
and the actions of our associates are also critical to effective risk
management. Through our Code of Ethics, we set a high standard for
our associates. The Code of Ethics provides a framework for all of our
associates to conduct themselves with the highest integrity in the
delivery of our products or services to our customers. Additionally, we
have continued to strengthen the linkage between the associate per-
formance management process and individual compensation to
encourage associates to work toward corporate-wide risk goals.
Oversight
The Board of Directors evaluates risk through the Chief Executive
Officer (CEO) and three Board committees. The Finance Committee
reviews market, credit, liquidity and operational risk; the Asset Quality
Committee reviews credit and related market risk; and the Audit
Committee reviews the scope and coverage of external and corporate
audit activities. Additionally, Senior Management oversight of our risk-
taking and risk management activities is conducted through three
senior management committees, the Risk and Capital Committee
(RCC), the Asset and Liability Committee (ALCO) and the Credit Risk
Committee (CRC). The RCC establishes long-term strategy and short-
term operating plans. The RCC also establishes our risk appetite
through corporate performance measures, capital allocations, aggre-
gate risk levels and overall capital planning. The RCC reviews actual
performance to plan and actual risk incurred to approved risk levels,
including information regarding credit, market and operational risk.
The ALCO, a subcommittee of the Finance Committee, approves lim-
its for various trading activities, as well as oversees Corporate
Treasury’s process of using various financial instruments, both cash
and derivative positions to manage interest rate risk inherent in our
businesses, otherwise known as the ALM process. ALCO also reviews
portfolio hedging used for managing liquidity, market and credit port-
folio risks as well as interest rate risk inherent in our nontrading
financial instruments and trading risk inherent in our customer and
proprietary trading portfolio. Trading risk refers to the risk of loss of
value and related net interest income of our trading positions. The
CRC establishes corporate credit practices and limits, including
industry and country concentration limits, approval requirements and
exceptions. CRC also reviews business asset quality results versus
plan, portfolio management, hedging results and the adequacy of the
allowance for credit losses.
The following sections, Liquidity Risk Management, Credit Risk
Management beginning on page 44, Market Risk Management
beginning on page 50 and Operational Risk Management on page
55, address in more detail the specific procedures, measures and
analyses of the four categories of risk that we manage.
38 BANK OF AMERICA 2003 BANK OF AMERICA 2003 39