Bank of America 2003 Annual Report Download - page 48
Download and view the complete annual report
Please find page 48 of the 2003 Bank of America annual report below. You can navigate through the pages in the report by either clicking on the pages listed below, or by using the keyword search tool below to find specific information within the annual report.-
 1
1 -
2
-
3
-
4
-
5
-
6
-
7
-
8
-
9
-
10
-
11
-
12
-
13
-
14
-
15
-
16
-
17
-
18
-
19
-
20
-
21
-
22
-
23
-
24
-
25
-
26
-
27
-
28
-
29
-
30
-
31
-
32
-
33
-
34
-
35
-
36
-
37
-
 38
38 -
 39
39 -
 40
40 -
 41
41 -
 42
42 -
 43
43 -
 44
44 -
 45
45 -
 46
46 -
 47
47 -
 48
48 -
 49
49 -
 50
50 -
 51
51 -
 52
52 -
 53
53 -
 54
54 -
 55
55 -
 56
56 -
 57
57 -
 58
58 -
59
-
60
-
61
 |
 |

92 BANK OF AMERICA 2003
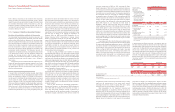
a material impact on the Corporation’s results of operations or finan-
cial condition. At December 31, 2003, the remaining consolidated
assets and liabilities were reflected in available-for-sale debt securi-
ties, other assets, and commercial paper and other short-term bor-
rowings in the Global Corpo rate and Inve stme nt Banking business
segment. As of December 31, 2003, the Corporation’s loss expo-
sure associated with these entities including unfunded lending com-
mitments was approximately $6.4 billion.
Additionally, the Corporation had significant involvement with
other VIEs that it did not consolidate because it was not deemed to
be the primary beneficiary. In such cases, the Corporation does not
absorb the majority of the entities’ expected losses nor does it
receive a majority of the entities’ expected residual returns, or both.
These entities facilitate client transactions, and the Corporation func-
tions as administrator for all of these and provides either liquidity and
letters of credit or derivatives to the VIE. The Corporation typically
obtains variable interests in these types of entities at the inception
of the transaction. Total assets of these entities at December 31,
2003 and 2002 were approximately $28.7 billion and $11.1 billion,
respectively; revenues associated with administration, liquidity, let-
ters of credit and other services were approximately $334 million in
2003 and $341 million in 2002. At December 31, 2003 and 2002,
the Corporation’s loss exposure associated with these VIEs was
approximately $17.7 billion and $5.1 billion, respectively, which is net
of amounts syndicated.
Additionally, the Corporation had contractual relationships with
other VIEs that engaged in leasing or lending activities and were con-
solidated by the Corporation prior to FIN 46. The amount of assets of
these entities as of December 31, 2003 was $1.5 billion and the
Corporation’s maximum possible loss exposure was $1.3 billion.
Management does not believe losses resulting from its
involvement with the entities discussed above will be material.
See Note 1 of the consolidated financial statements for additional
discussion of special purpose financing entities.
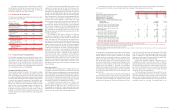
Note 10 Goodwill and Other Intangibles
At December 31, 2003 and 2002, allocated goodwill was $7.7 billion
in Consume r and Comme rcial Banking,$1.5 billion in Asse t
Manage me nt and $134 million in Equity Inve stme nts. At December 31,
2003 and 2002, goodwill was $2.1 billion and $2.0 billion, respec-
tively, in Global Corporate and Inve stme nt Banking.
In accordance with SFAS 142, no goodwill amortization was
recorded in 2003 or 2002. Goodwill amortization expense in 2001
was $662 million. Net income in 2001 was $6.8 billion or $4.26 per
common share ($4.18 per diluted common share). Net income
adjusted to exclude goodwill amortization expense would have been
$7.4 billion or $4.64 per common share ($4.56 per diluted com-
mon share) in 2001. The impact of goodwill amortization on net
income in 2001 was $616 million or $0.38 per common share
(basic and diluted).
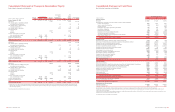
The gross carrying value and accumulated amortization related
to core deposit intangibles and other intangibles at December 31,
2003 and 2002 are presented below:
December 31, 2003 December 31, 200
2
Gross Gross
Carrying Accumulated Carrying Accumulated
(Dollars in millions)
Value Amortization Value Amortization
Core deposit intangibles
$1,495 $ 886 $1,495 $ 726
Other intangibles
787 488 757 431
Total
$2,282 $1,374 $2,252 $1,157
Amortization expense on core deposit intangibles and other intangi-
bles was $217 million, $218 million and $216 million in 2003, 2002
and 2001, respectively. The Corporation estimates that aggregate
amortization expense will be $216 million for 2004, $214 million for
2005, $206 million for 2006, $125 million for 2007 and $61 million
for 2008.
Note 11 Deposits
The Corporation had domestic certificates of deposit of $100 thou-
sand or more totaling $32.8 billion and $23.0 billion at December
31, 2003 and 2002, respectively. The Corporation had other domes-
tic time deposits of $100 thousand or more totaling $1.0 billion and
$977 million at December 31, 2003 and 2002, respectively. Foreign
certificates of deposit and other foreign time deposits of $100 thou-
sand or more totaled $15.4 billion and $16.4 billion at December 31,
2003 and 2002, respectively.
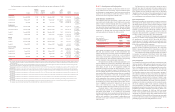
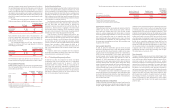
The following table presents the maturities of domestic certifi-
cates of deposit of $100 thousand or more and of other domestic
time deposits of $100 thousand or more at December 31, 2003.
BANK OF AMERICA 2003 93
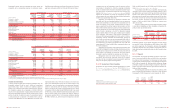
Corporation’s balance sheet and increasing net interest income and
charge-offs, with a corresponding reduction in noninterest income.
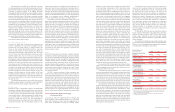
Portfolio balances, delinquency and historical loss amounts of the man-
aged loans and leases portfolio for 2003 and 2002 were as follows:
Variable Interest Entities
In January 2003, the FASB issued FIN 46 that addresses VIEs. The
Corporation adopted FIN 46 on July 1, 2003 and consolidated
approximately $12.2 billion of assets and liabilities related to
certain of its multi-seller asset-backed commercial paper conduits.
The Corporation entered into a transaction in October 2003 that
resulted in the deconsolidation of approximately $8.0 billion of the
previously consolidated assets and liabilities related to one of these
entities (the Entity). The Entity’s issuance of a subordinated note to
a third party reduced our exposure to the Entity’s losses under liq-
uidity and credit agreements as these agreements are senior to the
subordinated note issued. There was no impact to net income as a
result of the deconsolidation. There was no material impact to Tier
1 Capital as a result of consolidation or the subsequent deconsoli-
dation and prior periods were not restated. There was no material
impact to net income as a result of applying FIN 46 on July 1, 2003.
In December 2003, the FASB issued FIN 46R. FIN 46R is an update
of FIN 46 and contains different implementation dates based on the
types of entities subject to the standard and based on whether a
company has adopted FIN 46. The Corporation anticipates adopting
FIN 46R as of March 31, 2004 and does not expect that it will have
December 31, 2003 December 31, 2002
Total Principal Principal Principal Total Principal Principal Principal
Amount of Amount of Loans Amount of Amount of Amount of Loans Amount of
Loans and Past Due Nonperforming Loans and Past Due Nonperforming
(Dollars in millions)
Leases 90 Days or More(1) Loans Leases 90 Days or More(1) Loans
Commercial – domestic
$96,644 $ 110 $ 1,507 $105,053 $132 $ 2,781
Commercial – foreign
15,293 29 586 19,912 – 1,359
Commercial real estate – domestic
19,043 23 140 19,910 91 161
Commercial real estate – foreign
324 – 2 295 – 3
Total commercial
131,304 162 2,235 145,170 223 4,304
Residential mortgage
140,513 – 531 108,197 – 612
Home equity lines
23,859 – 43 23,236 – 66
Direct/Indirect consumer
33,415 47 28 31,068 56 30
Consumer finance
5,589 35 32 8,384 61 19
Credit card
36,596 647 – 29,461 502 –
Foreign consumer
1,969 – 4 1,971 – 6
Total consumer
241,941 729 638 202,317 619 733
Total managed loans and leases
373,245 $ 891 $ 2,873 347,487 $842 $ 5,037
Loans in revolving securitizations
(1,782) (4,732)
Total held loans and leases
$371,463 $342,755
Year Ended December 31, 2003 Year Ended December 31, 2002
Average Average
Loans and Loans and Loans and Loans and
Leases Leases Net Net Loss Leases Leases Net Net Loss
(Dollars in millions)
Outstanding Losses Ratio(2) Outstanding Losses Ratio(2)
Commercial – domestic
$99,000 $ 757 0.76% $110,073 $1,471 1.34%
Commercial – foreign
17,489 306 1.75 21,287 521 2.45
Commercial real estate – domestic
19,740 41 0.21 21,161 37 0.18
Commercial real estate – foreign
302 – – 408 – –
Total commercial
136,531 1,104 0.81 152,929 2,029 1.33
Residential mortgage
127,059 40 0.03 97,204 42 0.04
Home equity lines
22,890 11 0.05 22,807 26 0.11
Direct/Indirect consumer
32,593 181 0.55 30,264 210 0.69
Consumer finance
6,888 212 3.08 10,533 255 2.42
Credit card
31,552 1,691 5.36 27,352 1,443 5.28
Other consumer – domestic
–39n/m –36n/m
Foreign consumer
1,977 5 0.24 2,021 5 0.25
Total consumer
222,959 2,179 0.98 190,181 2,017 1.06
Total managed loans and leases
359,490 $ 3,283 0.91% 343,110 $4,046 1.18%
Loans in revolving securitizations
(3,342) (6,291)
Total held loans and leases
$356,148 $336,819
n/m = not meaningful
(1) Excludes consumer real estate loans, which are placed on nonperforming status at 90 days past due.
(2) The net loss ratio is calculated by dividing managed loans and leases net losses by average managed loans and leases outstanding for each loan and lease category.
Over
Three Over three six months
months months to to twelve
(Dollars in millions)
or less six months months Thereafter Total
Certificates of deposit of $100 thousand or more
$13,569 $7,163 $7,684 $4,351 $ 32,767
Other time deposits of $100 thousand or more
77 73 117 772 1,039