Bank of America 2003 Annual Report Download - page 17
Download and view the complete annual report
Please find page 17 of the 2003 Bank of America annual report below. You can navigate through the pages in the report by either clicking on the pages listed below, or by using the keyword search tool below to find specific information within the annual report.-
 1
1 -
2
-
3
-
4
-
5
-
6
-
 7
7 -
 8
8 -
 9
9 -
 10
10 -
 11
11 -
 12
12 -
 13
13 -
 14
14 -
 15
15 -
 16
16 -
 17
17 -
 18
18 -
 19
19 -
 20
20 -
 21
21 -
 22
22 -
 23
23 -
 24
24 -
 25
25 -
 26
26 -
 27
27 -
28
-
29
-
30
-
31
-
32
-
33
-
34
-
35
-
36
-
37
-
38
-
39
-
40
-
41
-
42
-
43
-
44
-
45
-
46
-
47
-
48
-
49
-
50
-
51
-
52
-
53
-
54
-
55
-
56
-
57
-
58
-
59
-
60
-
61
 |
 |

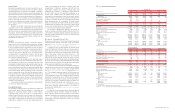
Trading-related Revenue
Trading account profits represent the net amount earned from our
trading positions, which include trading account assets and liabilities
as well as derivative positions and mortgage banking certificates.
Trading account profits, as reported in the Consolidated Statement of
Income, do not include the net interest income recognized on trading
positions or the related funding charge or benefit.
Trading account profits and trading-related net interest income
(trading-related revenue) are presented in the following table as they
are both considered in evaluating the overall profitability of our trading
activities. Trading-related revenue is derived from foreign exchange
spot, forward and cross-currency contracts, fixed income and equity
securities, and derivative contracts in interest rates, equities, credit,
commodities and mortgage banking certificates.
Table 3
Trading-related Revenue(1)
(Dollars in millions)
2003 2002 2001
Net interest income
(fully taxable-equivalent basis)
$2,214 $1,976 $1,609
Trading account profits(2)
409 778 1,842
Total trading-related
revenue
$2,623 $2,754 $3,451
Trading-related revenue
by product
Fixed income
$1,195 $811 $ 992
Interest rate (fully taxable-
equivalent basis)
897 832 792
Foreign exchange
549 532 532
Equities(3)
359 401 901
Commodities
(47) 94 165
Market-based trading-related
revenue
2,953 2,670 3,382
Credit portfolio hedges(4)
(330) 84 69
Total trading-related
revenue
$2,623 $2,754 $3,451
(1) Certain prior period amounts have been reclassified to conform to current period presentation.
(2) Includes $83 transition adjustment net loss in 2001 recorded as a result of the adoption of
SFAS No. 133 “Accounting for Derivative Instruments and Hedging Activities” (SFAS 133).
(3) Does not include commission revenue from equity transactions.
(4) Includes credit default swaps used for credit risk management.
Trading-related revenue decreased five percent to $2.6 billion for
2003 as compared to 2002 as the $238 million increase in net inter-
est income was more than offset by a $369 million decrease in trad-
ing account profits. The 2003 increase in fixed income trading-related
revenue of $384 million was a result of stronger product origination
and distribution flow, in support of investor demand. Driving these
results were increased profits in high-yield securities of $283 million
and mortgage-backed securities of $23 million. The increase in inter-
est rate trading-related revenue of $65 million was a result of a gen-
eral increase in trading profits within our strategic trading platform.
The $414 million decrease in revenues from our credit portfolio
hedges was a result of credit spreads continuing to tighten as overall
credit quality improved. This was the primary driver of the decrease
in overall trading account profits for 2003 compared to 2002.
Another driver of the decrease in trading-related revenue was the $89
million loss in the commodity portfolio associated with the adverse
impact on jet fuel prices from the outbreak of Severe Acute
Respiratory Syndrome (SARS) in the second quarter of 2003.
Complex Accounting Estimates and Principles
Our significant accounting principles are described in Note 1 of the
consolidated financial statements and are essential in understanding
Management’s Discussion and Analysis of Results of Operations and
Financial Condition. Some of our accounting principles require signif-
icant judgment to estimate values of either assets or liabilities.
In addition, certain accounting principles require significant judgment
in applying the complex accounting principles to complicated trans-
actions to determine the most appropriate treatment. We have estab-
lished procedures and processes to facilitate making the judgments
necessary to estimate the values of our assets and liabilities and to
analyze complex transactions to prepare financial statements.
The following is a summary of the more judgmental estimates
and complex accounting principles. In each area, we have identified
and described the development of the variables most important in
the estimation process that, with the exception of accrued taxes,
involves mathematical models used to derive the estimates. In many
cases, there are numerous alternative judgments that could be used
in the process of determining the inputs to the model. Where alter-
natives exist, we have used the factors that we believe represent the
most reasonable value in developing the inputs. Actual performance
that differs from our estimates of the key variables could impact net
income. Separate from the possible future impact to net income from
input and model variables, the value of our lending portfolio and mar-
ket sensitive assets and liabilities may change subsequent to the bal-
ance sheet measurement, often significantly, due to the nature and
magnitude of future credit and market conditions. Such credit and
market conditions may change quickly and in unforeseen ways and
the resulting volatility could have a significant, negative effect on
future operating results and such fluctuations would not be indicative
of deficiencies in our models or inputs.
Allowance for Credit Losses
The allowance for credit losses is our estimate of the probable losses
in the loans and leases portfolio and within our unfunded lending
commitments.
Changes to the allowance for credit losses are reported in the
Consolidated Statement of Income in the provision for credit losses.
Our process for determining the allowance for credit losses is dis-
cussed in detail in the Credit Risk Management section beginning on
page 44 and Note 1 of the consolidated financial statements. Due to
the variability in the drivers of the assumptions made in this process,
estimates of the portfolio’s inherent risks and overall collectibility will
change as warranted by changes in the economy, individual industries
and individual borrowers. The degree to which any particular assump-
tion would affect the allowance for credit losses would depend on the
severity of the change, and changes made, if necessary, to the other
assumptions made in this process.
Key judgments used in determining the allowance for credit
losses include: (i) risk ratings for pools of commercial loans, (ii) mar-
ket and collateral values and discount rates for individually evaluated
loans, (iii) product type classifications for both commercial and con-
sumer loans, (iv) loss rates used for both commercial and consumer
loans and (v) adjustments made to assess current events and con-
ditions. Additionally, considerations regarding domestic and global
economic uncertainty and overall credit conditions are used in calcu-
lating the allowance for credit losses.
The process of determining the level of the allowance for credit
losses requires a high degree of judgment. It is possible that others,
given the same information, may at any point in time reach different
reasonable conclusions. For management analysis purposes, we do
not develop alternative judgments regarding the allowance for credit
losses because we do not believe such alternative judgments would
provide useful information for determining the recorded allowance.
While we do not develop alternative judgments, alternative judgments
could result in different estimates of the required allowance for credit
losses given a particular set of circumstances and such differences
could be material.
Fair Value of Financial Instruments
Trading account assets and liabilities are recorded at fair value,
which is primarily based on actively traded markets where prices can
be obtained from either direct market quotes or observed trans-
actions. A significant factor affecting the fair value of trading
account assets or liabilities is the liquidity of a specific position
within the market. Market price quotes may not be readily available
for some specific positions, or positions within a market sector
where trading activity has slowed significantly or ceased. Situations
of illiquidity generally are triggered by the market’s perception of
credit regarding a single company or a specific market sector. In
these instances, fair valuations are derived from the limited market
information available and other factors, principally from reviewing
the issuer’s financial statements and changes in credit ratings made
by one or more of the rating agencies. At December 31, 2003,
$1.8 billion of trading account assets were fair valued using these
alternative approaches, representing three percent of total trading
account assets at December 31, 2003. An immaterial amount of
trading account liabilities were fair valued using these alternative
approaches at December 31, 2003.
Fair values of derivative assets and liabilities traded in the over-
the-counter market are determined using quantitative models that
require the use of multiple market inputs including rates, prices and
indices to generate continuous yield or pricing curves and volatility
factors, which are used to value the position. The predominance of
market inputs utilized are actively quoted and can be validated
through external sources, including brokers, market transactions and
third party pricing services. Estimation risk is greater for derivative
asset and liability positions that are either option-based or have
longer maturity dates where observable market inputs are less read-
ily available or are altogether unobservable, in which case quantita-
tive-based extrapolations of rate, price or index scenarios are used in
determining fair values.
The fair values of derivative assets and liabilities include adjust-
ments for market liquidity, counterparty credit quality, future servicing
costs and other deal specific factors, where appropriate. To ensure
the prudent application of estimates and management judgment in
determining the fair value of derivative assets and liabilities, various
processes and controls have been adopted, which include: a Model
Validation Policy that requires a review and approval of quantitative
models used for deal pricing, financial statement fair value determi-
nation and risk quantification; a Trading Product Valuation Policy that
requires verification of all traded product valuations; and a periodic
review and substantiation of daily profit and loss reporting for all
traded products. These processes and controls are performed inde-
pendent of the business segment. At December 31, 2003, the fair
values of derivative assets and liabilities determined by these quan-
titative models were $10.7 billion and $7.9 billion, respectively.
These amounts reflect the full fair value of the derivatives and do not
isolate the discrete value associated with the subjective valuation
variable. Further, they represent five percent and four percent of deriv-
ative assets and liabilities, respectively, before the impact of legally
enforceable master netting agreements. For the period ended
December 31, 2003, there were no changes to the quantitative models,
or uses of such models, that resulted in a material adjustment to the
income statement.
Excess Spread Certificates (the Certificates), a mortgage bank-
ing asset, are carried at estimated fair value. The Certificates do not
have readily observable prices; therefore, we value them using an
option-adjusted spread model that requires several key components
including the option-adjusted spread levels, portfolio characteristics,
proprietary prepayment models, and delinquency rates. We compare
our fair value estimates and assumptions to observable market data,
where available, to recent market activity, portfolio experience and
values necessary to meet reasonable return objectives. At December
31, 2003 and 2002, $2.3 billion and $1.6 billion of the Certificates
were valued using this model. For more information on mortgage
banking assets, see Notes 1 and 8 of the consolidated financial
statements.
Available-for-sale securities are recorded at fair value, which is
based on direct market quotes from actively traded markets. None of
the available-for-sale securities were valued using mathematical models.
Principal Investing
Principal Inve sting within the Equity Inve stme nts segment, discussed
in more detail in Business Segment Operations on page 38, is com-
prised of a diversified portfolio of investments in privately-held and
publicly-traded companies at all stages, from start-up to buyout.
These investments are made either directly in a company or held
through a fund. Some of these companies may need access to addi-
tional cash to support their long-term business models. Market con-
ditions as well as company performance may impact whether such
funding is sourced from private investors or via capital markets.
Investments for which there are active market quotes are
carried at estimated fair value. The majority of our investments do not
have publicly available price quotations. At December 31, 2003, we
had nonpublic investments of $5.0 billion or approximately 94 per-
cent of the total portfolio. Valuation of these investments requires
significant management judgment. Management determines values
of the underlying investments based on varying methodologies includ-
ing periodic reviews of the investee’s financial statements and finan-
cial condition, discounted cash flows, the prospects of the investee’s
industry and current overall market conditions for similar invest-
ments. Periodically, when events occur or information comes to the
attention of management regarding one or more investments that
indicate a change in value of that investment is warranted, invest-
ments are adjusted from their original invested amount to estimated
market values at the balance sheet date with changes being recorded
in equity investment gains (losses) in the Consolidated Statement of
Income. Investments are not adjusted above the original amount
invested unless there is clear evidence of a market value in excess
of the original invested amount. This evidence is typically in the form
of a recent transaction in that particular investment. As part of the
valuation process, senior management reviews the portfolio and
determines when an impairment needs to be recorded. The Principal
Inve sting portfolio is not material to our Consolidated Balance Sheet,
but the impact of the valuation adjustments may be material to our
operating results for any particular quarter.
30 BANK OF AMERICA 2003 BANK OF AMERICA 2003 31