Bank of America 2003 Annual Report Download - page 18
Download and view the complete annual report
Please find page 18 of the 2003 Bank of America annual report below. You can navigate through the pages in the report by either clicking on the pages listed below, or by using the keyword search tool below to find specific information within the annual report.-
 1
1 -
2
-
3
-
4
-
5
-
6
-
7
-
 8
8 -
 9
9 -
 10
10 -
 11
11 -
 12
12 -
 13
13 -
 14
14 -
 15
15 -
 16
16 -
 17
17 -
 18
18 -
 19
19 -
 20
20 -
 21
21 -
 22
22 -
 23
23 -
 24
24 -
 25
25 -
 26
26 -
 27
27 -
 28
28 -
29
-
30
-
31
-
32
-
33
-
34
-
35
-
36
-
37
-
38
-
39
-
40
-
41
-
42
-
43
-
44
-
45
-
46
-
47
-
48
-
49
-
50
-
51
-
52
-
53
-
54
-
55
-
56
-
57
-
58
-
59
-
60
-
61
 |
 |

BANK OF AMERICA 2003 33
Accrued Taxes
We estimate tax expense based on the amount we expect to owe var-
ious tax jurisdictions. We currently file income tax returns in approxi-
mately 85 jurisdictions. Our estimate of tax expense is reported in
the Consolidated Statement of Income. Accrued taxes represent the
net estimated amount due or to be received from taxing jurisdictions
either currently or in the future and are reported as a component of
accrued expenses and other liabilities on the Consolidated Balance
Sheet. In estimating accrued taxes, we assess the relative merits
and risks of the appropriate tax treatment of transactions taking into
account statutory, judicial and regulatory guidance in the context of
our tax position.
Changes to our estimate of accrued taxes occur periodically due
to changes in the tax rates, implementation of new tax planning
strategies, resolution with taxing authorities of issues with previously
taken tax positions and newly enacted statutory, judicial and regula-
tory guidance. These changes, when they occur, affect accrued taxes
and can be material to our operating results for any particular quar-
ter. Taxes are discussed in more detail in Notes 1 and 18 of the con-
solidated financial statements.
Goodwill
The nature and accounting for goodwill is discussed in detail in
Notes 1 and 10 of the consolidated financial statements. Assigned
goodwill is subject to a market value recoverability test that records
a loss if the implied fair value of goodwill is less than the amount
recorded in the financial statements for any individual reporting unit.
The first part of this test is a comparison, at the reporting unit level,
of the fair value of each reporting unit to its carrying amount,
including goodwill. The reporting units utilized for this test were
those that are one level below the core business segments identi-
fied in Business Segment Operations.
The fair values of the reporting units are determined using a
discounted cash flow model. The discounted cash flows were calcu-
lated by taking the net present value of estimated cash flows using
a combination of historical results, estimated future cash flows and
an appropriate price to earnings multiple. We use our internal fore-
casts to estimate future cash flows and actual results typically differ
from forecasted results. However, these differences have not been
material and we believe that this methodology provides a reasonable
means to determine fair values. Cash flows are discounted using a
discount rate based on a weighted average cost of capital resulting
in a range of 8.7 percent to 11 percent. Weighted average cost of
capital is determined using the 10-year U.S. Treasury rate adjusted
for estimated required market returns and risk/return rates for similar
industries of the reporting unit.
Our evaluations for the year ended December 31, 2003 indicated
that none of our goodwill was impaired.
Accounting Standards
Our accounting for hedging activities, securitizations and off-balance
sheet entities requires significant judgment in interpreting and
applying the accounting principles related to these matters.
Judgments include, but are not limited to: the determination of
whether a financial instrument or other contract meets the definition
of a derivative in accordance with SFAS 133 and the applicable
hedge criteria including whether the derivative used in our hedging
transactions is expected to be or has been highly effective as a
hedge; the accounting for the transfer of financial assets and
extinguishments of liabilities in accordance with SFAS No. 140,
“Accounting for Transfers and Servicing of Financial Assets and
Extinguishments of Liabilities – a replacement of FASB Statement
No. 125” (SFAS 140) and the applicable determination as to
whether assets transferred meet the specific criteria for sale
accounting; and the determination of when certain special purpose
entities should be consolidated on our balance sheet and statement
of income in accordance with Financial Accounting Standards Board
(FASB) Interpretation No. 46 “Consolidation of Variable Interest
Entities, an interpretation of ARB No. 51” (FIN 46) and the applica-
ble determination of expected losses and returns as defined in FIN
46. For a more complete discussion of these principles, see Notes
1, 6 and 9 of the consolidated financial statements.
The remainder of Management’s Discussion and Analysis of
Results of Operations and Financial Condition should be read in con-
junction with the consolidated financial statements and related notes
presented on pages 74 through 115. See Note 1 for Recently Issued
Accounting Pronouncements.
Business Segment Operations
We provide our customers and clients both traditional banking and
nonbanking financial products and services through four business
segments: Consume r and Comme rcial Banking, Asse t Manage me nt,
Global Corporate and Inve stme nt Banking and Equity Inve stme nts.
In managing our four business segments, we evaluate results
using both financial and nonfinancial measures. Financial measures
consist primarily of revenue, net income and SVA. Nonfinancial meas-
ures include, but are not limited to, market share and customer satis-
faction. Total revenue includes net interest income on a fully
taxable-equivalent basis and noninterest income. The net interest
income of the business segments includes the results of a funds
transfer pricing process that matches assets and liabilities with simi-
lar interest rate sensitivity and maturity characteristics. Net interest
income also reflects an allocation of net interest income generated by
certain assets and liabilities used in our ALM process.
From time to time, we refine the business segment strategy and
reporting. As we continued to refine our business segment strategy
in 2002, we moved a portion of our thirty-year mortgage portfolio
from the Consume r and Comme rcial Banking segment to Corporate
Othe r. The mortgages designated solely for our ALM process were
moved to Corpo rate Othe r to reflect the fact that management deci-
sions regarding this portion of the mortgage portfolio are driven by
corporate ALM considerations and not by the business segments’
management. In the third quarter of 2002, certain consumer finance
businesses in the process of liquidation (subprime real estate, auto
leasing and manufactured housing) were transferred from Consume r
and Comme rcial Banking to Corporate Othe r and in the first quarter of
2003, certain commercial lending businesses in the process of
liquidation were transferred from Consume r and Co mme rcial Banking
to Corporate Othe r.
See Note 20 of the consolidated financial statements for addi-
tional business segment information including the allocation of
certain expenses, selected financial information for the business
segments, reconciliations to consolidated amounts and information on
Corporate Othe r. Certain prior period amounts have been reclassified
among segments and their components to conform to the current
period presentation.
32 BANK OF AMERICA 2003
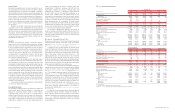
Table 4
Business Segment Summary
Consumer and
Total Corporation Commercial Banking(1) Asset Management(1)
(Dollars in millions) 2003 2002 2003 2002 2003 2002
Net interest income (fully taxable-equivalent basis)
$22,107 $21,511 $15,970 $15,205 $754 $752
Noninterest income
16,422 13,571 10,333 8,411 1,880 1,626
Total revenue
38,529 35,082 26,303 23,616 2,634 2,378
Provision for credit losses
2,839 3,697 2,062 1,806 1318
Gains on sales of debt securities
941 630 12 45 ––
Amortization of intangibles
217 218 179 175 66
Other noninterest expense
19,909 18,218 12,301 11,301 1,608 1,488
Income before income taxes
16,505 13,579 11,773 10,379 1,019 566
Income tax expense
5,695 4,330 4,252 3,836 349 191
Net income
$10,810 $9,249 $7,521 $6,543 $670 $375
Shareholder value added
$5,621 $3,760 $5,450 $4,392 $368 $81
Net interest yield (fully taxable-equivalent basis)
3.36% 3.75% 4.67% 5.26% 3.14% 3.06%
Return on average equity
21.99 19.44 36.79 33.77 23.97 14.99
Efficiency ratio (fully taxable-equivalent basis)
52.23 52.55 47.45 48.60 61.29 62.84
Average:
Total loans and leases
$356,148 $336,819 $188,706 $182,463 $23,143 $23,916
Total assets
764,132 662,943 364,703 312,973 25,851 26,079
Total deposits
406,233 371,479 312,582 283,255 13,162 12,030
Common equity/Allocated equity
49,148 47,552 20,444 19,376 2,794 2,500
Year end:
Total loans and leases
371,463 342,755 196,307 186,069 24,666 23,009
Total assets
736,445 660,951 386,330 339,976 27,540 25,645
Total deposits
414,113 386,458 326,235 297,646 14,710 13,305
Global Corporate and
Investment Banking(1) Equity Investments(1) Corporate Other
(Dollars in millions) 2003 2002 2003 2002 2003 2002
Net interest income (fully taxable-equivalent basis)
$4,825 $4,797 $(160) $(165) $718 $922
Noninterest income
4,108 3,880 (94) (281) 195 (65)
Total revenue
8,933 8,677 (254) (446) 913 857
Provision for credit losses
477 1,208 25 7274 358
Gains (losses) on sales of debt securities
(14) (97) ––943 682
Amortization of intangibles
28 32 3312
Other noninterest expense
5,407 5,031 108 88 485 310
Income before income taxes
3,007 2,309 (390) (544) 1,096 869
Income tax expense (benefit)
995 748 (141) (213) 240 (232)
Net income (loss)
$2,012 $1,561 $(249) $(331) $856 $1,101
Shareholder value added
$983 $251 $(475) $(583) $(705) $(381)
Net interest yield (fully taxable-equivalent basis)
1.98% 2.38% n/m n/m n/m n/m
Return on average equity
20.94 13.96 (11.91)% (15.56)% n/m n/m
Efficiency ratio (fully taxable-equivalent basis)
60.85 58.35 n/m n/m n/m n/m
Average:
Total loans and leases
$49,365 $63,133 $259 $440 $94,675 $66,867
Total assets
292,301 241,522 6,245 6,179 75,032 76,190
Total deposits
66,181 64,767 ––14,308 11,427
Common equity/Allocated equity(2)
9,611 11,183 2,086 2,125 14,213 12,368
Year end:
Total loans and leases
41,170 57,823 77 437 109,243 75,417
Total assets
248,833 220,241 6,251 6,064 67,491 69,025
Total deposits
58,590 67,212 ––14,578 8,295
n/m = not meaningful
(1) There were no material intersegment revenues among the segments.
(2) Equity in Corporate Othe r represents equity of the Corporation not allocated to the business segments.