Bank of America 2003 Annual Report Download - page 45
Download and view the complete annual report
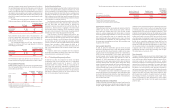
Please find page 45 of the 2003 Bank of America annual report below. You can navigate through the pages in the report by either clicking on the pages listed below, or by using the keyword search tool below to find specific information within the annual report.-
 1
1 -
2
-
3
-
4
-
5
-
6
-
7
-
8
-
9
-
10
-
11
-
12
-
13
-
14
-
15
-
16
-
17
-
18
-
19
-
20
-
21
-
22
-
23
-
24
-
25
-
26
-
27
-
28
-
29
-
30
-
31
-
32
-
33
-
34
-
 35
35 -
 36
36 -
 37
37 -
 38
38 -
 39
39 -
 40
40 -
 41
41 -
 42
42 -
 43
43 -
 44
44 -
 45
45 -
 46
46 -
 47
47 -
 48
48 -
 49
49 -
 50
50 -
 51
51 -
 52
52 -
 53
53 -
 54
54 -
 55
55 -
56
-
57
-
58
-
59
-
60
-
61
 |
 |

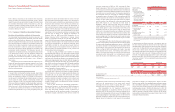
At December 31, 2003, net unrealized losses on available-for-sale
debt and marketable equity securities included in shareholders’
equity were $70 million, net of the related income tax benefit of $46
million. At December 31, 2002, net unrealized gains on these secu-
rities were $494 million, net of the related income tax expense of
$266 million.
The unrealized losses associated with U.S. Treasury securities and
agency debentures, mortgage-backed securities, certain foreign sov-
ereign securities, other taxable securities and tax-exempt securities
are not considered to be other-than-temporary because their unreal-
ized losses are related to changes in interest rates and do not affect
the expected cash flows of the underlying collateral or issuer. The
Corporation also has unrealized losses associated with other foreign
sovereign securities; however, these losses are not considered other-
than-temporary because the principal of these securities is guaran-
teed by the U.S. government.
Excluding securities issued by the U.S. government and its
agencies and corporations (including the Federal National Mortgage
Association (Fannie Mae) and the Federal Home Loan Mortgage
Corporation (Freddie Mac)), there were no investments in securities
from one issuer that exceeded 10 percent of consolidated share-
holders’ equity at December 31, 2003 or 2002.
Securities are pledged or assigned to secure borrowed funds,
government and trust deposits and for other purposes. The carrying
value of pledged securities was $20.9 billion and $32.9 billion at
December 31, 2003 and 2002, respectively.
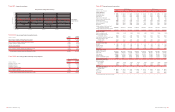
The expected maturity distribution and yields of the Corporation’s
securities portfolio at December 31, 2003 are summarized below.
Actual maturities may differ from the contractual or expected maturi-
ties shown in the following table since borrowers may have the right
to prepay obligations with or without prepayment penalties.
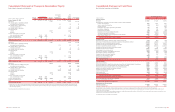
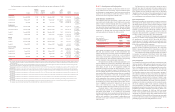
The following table presents the current fair value and the asso-
ciated unrealized losses only on investments in debt securities with
unrealized losses at December 31, 2003. Unrealized losses on mar-
ketable equity securities at December 31, 2003 were not considered
material. The table also discloses whether these securities have had
unrealized losses for less than 12 months, or for 12 months or longer.
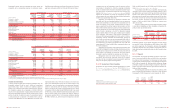
The components of realized gains and losses on sales of debt secu-
rities for 2003, 2002 and 2001 were:
(Dollars in millions)
2003 2002 2001
Gross gains
$1,246 $1,035 $1,074
Gross losses
(305) (405) (599)
Net gains on sales
of debt securities
$941 $630 $ 475
The income tax expense attributable to realized net gains on debt
securities sales was $329 million, $220 million and $166 million in
2003, 2002 and 2001, respectively.
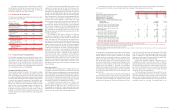
Note 5 Trading Account Assets and Liabilities
The Corporation engages in a variety of trading-related activities that
are either for clients or its own account.
The fair values of the components of trading account assets
and liabilities at December 31, 2003 and 2002 were:
December 31
(Dollars in millions)
2003 2002
Trading account assets
U.S. government and agency securities
$16,073 $19,875
Corporate securities, trading loans, and other
25,647 21,286
Equity securities
11,445 5,380
Mortgage trading loans and
asset-backed securities
8,221 8,703
Foreign sovereign debt
7,161 8,752
Total
$68,547 $63,996
Trading account liabilities
U.S. government and agency securities
$7,304 $8,531
Equity securities
8,863 4,825
Corporate securities, trading loans, and other
5,379 7,320
Foreign sovereign debt
5,276 3,465
Mortgage trading loans and
asset-backed securities
22 1,433
Total
$26,844 $25,574
86 BANK OF AMERICA 2003 BANK OF AMERICA 2003 87
Less than 12 months 12 months or longer Total
(Dollars in millions)
Fair Value Unrealized Losses Fair Value Unrealized Losses Fair Value Unrealized Losses
Debt securities
U.S. Treasury securities and agency debentures $ 210 $ (2) $ – $ – $ 210 $ (2)
Mortgage-backed securities(1) 41,067 (575) 12 – 41,079 (575)
Foreign sovereign securities 71 (7) 266 (31) 337 (38)
Other taxable securities 4,036 (69) – – 4,036 (69)
Tax-exempt securities(1) 20 (1) 22 – 42 (1)
Total temporarily-impaired debt securities $45,404 $ (654) $ 300 $ (31) $ 45,704 $ (685)
(1) Unrealized losses less than $500,000 are shown as zero.
Due after 1 Due after 5
Due in 1 year year through years through Due after
or less 5 years 10 years 10 years(1) Total
(Dollars in millions)
Amount Yield Amount Yield Amount Yield Amount Yield Amount Yield
Fair value of
available-for-sale debt securities
U.S. Treasury securities and
agency debentures $ 42 2.35% $ 554 3.03% $ 96 4.14% $ 21 5.54% $ 713 3.09%
Mortgage-backed securities 18 5.42 21,824 4.79 34,016 5.01 35 9.00 55,893 4.93
Foreign sovereign securities 188 3.99 1,627 2.12 79 5.35 907 3.77 2,801 2.88
Other taxable securities 34 3.64 4,015 8.47 630 5.09 1,662 5.59 6,341 7.37
Total taxable 282 3.79 28,020 5.13 34,821 5.01 2,625 5.01 65,748 5.06
Tax-exempt securities(2) 74.79 12 5.59 968 6.08 1,258 6.60 2,245 6.36
Total available-for-sale
debt securities $289 3.81% $28,032 5.13% $35,789 5.04% $3,883 5.53% $67,993 5.10%
Amortized cost of available-for-sale
debt securities $288 $28,149 $36,152 $3,885 $68,472
Amortized cost of
held-to-maturity debt securities
Mortgage-backed securities $ – –% $ 1 1.62% $ – –% $ – –% $ 1 1.62%
Foreign sovereign securities 7 3.73 27 2.09 – – 15 6.75 49 3.75
Other taxable securities – – – – 46 6.00 – – 46 6.02
Total taxable 7 3.73 28 2.07 46 6.00 15 6.75 96 4.82
Tax-exempt securities(2) 25 9.97 52 8.99 42 8.11 32 5.95 151 8.26
Total held-to-maturity
debt securities $328.61% $ 80 6.57% $ 88 7.01% $ 47 6.21% $ 247 6.92%
Fair value of held-to-maturity
debt securities $33 $ 88 $ 87$46$254
(1) Includes securities with no stated maturity.
(2) Yield of tax-exempt securities calculated on a fully taxable-equivalent basis.