Bank of America 2003 Annual Report Download - page 37
Download and view the complete annual report
Please find page 37 of the 2003 Bank of America annual report below. You can navigate through the pages in the report by either clicking on the pages listed below, or by using the keyword search tool below to find specific information within the annual report.-
 1
1 -
2
-
3
-
4
-
5
-
6
-
7
-
8
-
9
-
10
-
11
-
12
-
13
-
14
-
15
-
16
-
17
-
18
-
19
-
20
-
21
-
22
-
23
-
24
-
25
-
26
-
 27
27 -
 28
28 -
 29
29 -
 30
30 -
 31
31 -
 32
32 -
 33
33 -
 34
34 -
 35
35 -
 36
36 -
 37
37 -
 38
38 -
 39
39 -
 40
40 -
 41
41 -
 42
42 -
 43
43 -
 44
44 -
 45
45 -
 46
46 -
 47
47 -
48
-
49
-
50
-
51
-
52
-
53
-
54
-
55
-
56
-
57
-
58
-
59
-
60
-
61
 |
 |

BANK OF AMERICA 2003 71
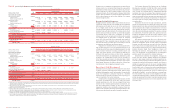
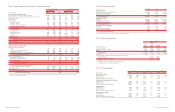
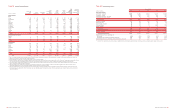
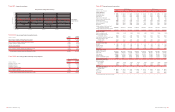
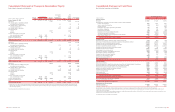
Table XX
Quarterly Average Balances and Interest Rates – Fully Taxable-equivalent Basis
Fourth Quarter 2003 Third Quarter 2003 Second Quarter 2003 First Quarter 2003 Fourth Quarter 2002
Interest Interest Interest Interest Interest
Average Income/ Yield/ Average Income/ Yield/ Average Income/ Yield/ Average Income/ Yield/ Average Income/ Yield/
(Dollars in millions) Balance Expense Rate Balance Expense Rate Balance Expense Rate Balance Expense Rate Balance Expense Rate
Earning assets
Time deposits placed and other short-term investments
$11,231 $ 49 1.71% $10,062 $ 41 1.63% $ 7,888 $ 39 1.99% $ 6,987 $ 43 2.49% $ 8,853 $ 56 2.49%
Federal funds sold and securities purchased under
agreements to resell
96,713 506 2.08 90,236 479 2.11 70,054 194 1.11 57,873 194 1.35 49,169 208 1.68
Trading account assets
94,630 927 3.91 96,105 991 4.11 99,129 1,022 4.13 99,085 1,053 4.27 84,181 994 4.71
Debt securities
60,801 763 5.02 65,024 639 3.93 95,614 1,028 4.30 67,784 793 4.69 83,751 1,078 5.15
Loans and leases(1):
Commercial – domestic
95,648 1,670 6.93 96,086 1,719 7.10 100,721 1,746 6.95 103,663 1,836 7.18 105,333 1,777 6.70
Commercial – foreign
16,226 136 3.31 16,885 151 3.55 18,004 170 3.79 18,876 156 3.35 20,538 180 3.48
Commercial real estate – domestic
19,293 207 4.28 19,681 210 4.23 20,039 218 4.36 19,955 215 4.37 20,359 245 4.77
Commercial real estate – foreign
323 3 3.97 280 3 4.16 305 3 3.95 301 3 3.88 426 4 3.93
Total commercial
131,490 2,016 6.09 132,932 2,083 6.22 139,069 2,137 6.16 142,795 2,210 6.27 146,656 2,206 5.97
Residential mortgage
142,482 1,931 5.41 130,948 1,656 5.05 120,754 1,703 5.64 113,695 1,582 5.59 108,019 1,699 6.28
Home equity lines
23,206 255 4.36 22,539 255 4.48 22,763 263 4.64 23,054 267 4.70 23,347 300 5.10
Direct/Indirect consumer
33,422 478 5.67 33,278 488 5.82 32,248 495 6.17 31,393 503 6.49 30,643 523 6.76
Consumer finance
5,798 108 7.38 6,528 121 7.39 7,244 137 7.58 8,012 154 7.76 8,943 174 7.75
Credit card
32,734 810 9.83 29,113 742 10.11 26,211 690 10.56 24,684 644 10.57 23,535 613 10.33
Foreign consumer
1,939 17 3.37 1,950 17 3.43 1,990 17 3.47 2,029 17 3.45 1,956 17 3.48
Total consumer
239,581 3,599 5.98 224,356 3,279 5.82 211,210 3,305 6.27 202,867 3,167 6.30 196,443 3,326 6.74
Total loans and leases
371,071 5,615 6.02 357,288 5,362 5.97 350,279 5,442 6.23 345,662 5,377 6.29 343,099 5,532 6.41
Other earning assets
40,766 367 3.59 58,593 516 3.50 40,536 429 4.24 35,701 417 4.71 32,828 417 5.07
Total earning assets(2)
675,212 8,227 4.85 677,308 8,028 4.72 663,500 8,154 4.92 613,092 7,877 5.18 601,881 8,285 5.48
Cash and cash equivalents
22,974 22,660 23,203 21,699 21,242
Other assets, less allowance for loan and lease losses
82,348 86,185 88,381 78,989 72,812
Total assets
$780,534 $786,153 $775,084 $713,780 $695,935
Interest-bearing liabilities
Domestic interest-bearing deposits:
Savings
$25,494 $ 19 0.30% $25,285 $ 20 0.31% $ 24,420 $ 35 0.58% $ 22,916 $ 34 0.59% $ 22,142 $ 35 0.63%
NOW and money market deposit accounts
155,369 401 1.02 151,424 249 0.65 146,284 295 0.81 142,338 291 0.83 137,229 325 0.94
Consumer CDs and IRAs
73,246 475 2.58 71,216 872 4.85 69,506 742 4.28 66,937 695 4.21 66,266 728 4.36
Negotiable CDs, public funds and other time deposits
6,195 44 2.81 7,771 25 1.27 12,912 45 1.41 3,598 16 1.78 3,400 17 1.97
Total domestic interest-bearing deposits
260,304 939 1.43 255,696 1,166 1.81 253,122 1,117 1.77 235,789 1,036 1.78 229,037 1,105 1.91
Foreign interest-bearing deposits(3):
Banks located in foreign countries
13,225 177 5.34 12,273 59 1.90 16,150 87 2.16 14,218 80 2.27 15,286 104 2.70
Governments and official institutions
2,654 11 1.58 2,032 6 1.21 2,392 8 1.42 1,785 6 1.31 1,737 7 1.68
Time, savings and other
20,019 51 1.02 18,792 47 1.00 19,209 57 1.18 18,071 61 1.38 17,929 76 1.68
Total foreign interest-bearing deposits
35,898 239 2.65 33,097 112 1.35 37,751 152 1.61 34,074 147 1.75 34,952 187 2.12
Total interest-bearing deposits
296,202 1,178 1.58 288,793 1,278 1.76 290,873 1,269 1.75 269,863 1,183 1.78 263,989 1,292 1.94
Federal funds purchased, securities sold under agreements
to repurchase and other short-term borrowings
151,999 537 1.40 162,080 447 1.09 152,722 514 1.35 123,041 453 1.49 123,434 558 1.79
Trading account liabilities
38,298 317 3.28 36,903 345 3.71 38,610 316 3.28 34,858 308 3.58 30,445 289 3.77
Long-term debt(4)
70,596 450 2.55 66,788 481 2.88 68,927 531 3.08 67,399 572 3.40 65,702 609 3.71
Total interest-bearing liabilities(2)
557,095 2,482 1.77 554,564 2,551 1.83 551,132 2,630 1.91 495,161 2,516 2.05 483,570 2,748 2.26
Noninterest-bearing sources:
Noninterest-bearing deposits
122,638 125,776 114,434 115,897 117,392
Other liabilities
52,508 56,942 59,249 53,322 46,899
Shareholders’ equity
48,293 48,871 50,269 49,400 48,074
Total liabilities and shareholders’ equity
$780,534 $786,153 $775,084 $713,780 $695,935
Net interest spread
3.08 2.89 3.01 3.13 3.22
Impact of noninterest-bearing sources
0.31 0.33 0.32 0.39 0.44
Net interest income/yield on earning assets
$5,745 3.39% $5,477 3.22% $5,524 3.33% $5,361 3.52% $5,537 3.66%
(1) Nonperforming loans are included in the respective average loan balances. Income on such nonperforming loans is recognized on a cash basis.
(2) Interest income includes the impact of interest rate risk management contracts, which increased interest income on the underlying assets $884, $925, $587 and $576 in the fourth, third, second and
first quarters of 2003 and $517 in the fourth quarter of 2002, respectively. These amounts were substantially offset by corresponding decreases in the income earned on the underlying assets.
Interest expense includes the impact of interest rate risk management contracts, which increased interest expense on the underlying liabilities $90, $141, $28 and $46 in the fourth, third, second and
first quarters of 2003 and $62 in the fourth quarter of 2002, respectively. These amounts were substantially offset by corresponding decreases in the interest paid on the underlying liabilities.
For further information on interest rate contracts, see “Interest Rate Risk Management” beginning on page 52.
(3) Primarily consists of time deposits in denominations of $100,000 or more.
(4) Includes long-term debt related to Trust Securities.
70 BANK OF AMERICA 2003