Bank of America 2003 Annual Report Download - page 58
Download and view the complete annual report
Please find page 58 of the 2003 Bank of America annual report below. You can navigate through the pages in the report by either clicking on the pages listed below, or by using the keyword search tool below to find specific information within the annual report.-
 1
1 -
2
-
3
-
4
-
5
-
6
-
7
-
8
-
9
-
10
-
11
-
12
-
13
-
14
-
15
-
16
-
17
-
18
-
19
-
20
-
21
-
22
-
23
-
24
-
25
-
26
-
27
-
28
-
29
-
30
-
31
-
32
-
33
-
34
-
35
-
36
-
37
-
38
-
39
-
40
-
41
-
42
-
43
-
44
-
45
-
46
-
47
-
 48
48 -
 49
49 -
 50
50 -
 51
51 -
 52
52 -
 53
53 -
 54
54 -
 55
55 -
 56
56 -
 57
57 -
 58
58 -
 59
59 -
 60
60 -
 61
61
 |
 |

112 BANK OF AMERICA 2003 BANK OF AMERICA 2003 113
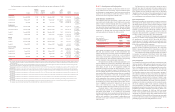
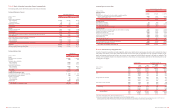
Reconciliations of the four business segments’ revenue, net income and assets to consolidated totals follow:
Year Ended December 31
(Dollars in millions)
2003 2002 2001
Segments’ revenue
$37,616 $34,225 $ 33,655
Adjustments:
Revenue associated with unassigned capital
616 669 498
ALM activities(1)
560 319 (147)
Liquidating businesses
310 481 1,383
Fully taxable-equivalent basis adjustment
(643) (588) (343)
SFAS 133 transition adjustment net loss
––(106)
Other
(573) (612) (302)
Consolidated revenue
$37,886 $34,494 $ 34,638
Segments’ net income
$9,954 $8,148 $ 7,599
Adjustments, net of taxes:
Gains on sales of debt securities
643 460 332
Earnings associated with unassigned capital
420 451 320
ALM activities(1)
382 146 (103)
Liquidating businesses
(27) 23 219
Litigation expense
(150) –(214)
Tax settlement
–488 –
Severance charge
–(86) (96)
Tax benefit associated with basis difference in subsidiary stock
––267
SFAS 133 transition adjustment net loss
––(68)
Provision for credit losses in excess of net charge-offs
––(182)
Exit charges
––(1,250)
Other
(412) (381) (32)
Consolidated net income
$10,810 $9,249 $ 6,792
December 31
2003 2002
Segments’ total assets
$668,954 $591,926
Adjustments:
ALM activities(1)
103,313 65,447
Securities portfolio
61,253 65,979
Liquidating businesses
6,503 9,294
Elimination of excess earning asset allocations
(144,894) (107,746)
Other, net
41,316 36,051
Consolidated total assets
$736,445 $660,951
(1) Includes whole mortgage loan sale gains.
The adjustments presented in the table above include consolidated income, expense and asset amounts not specifically allocated to individual
business segments.
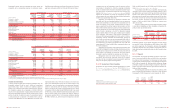
The following table presents total revenue and net income for 2003, 2002 and 2001, and total assets at December 31, 2003 and 2002 for
each business segment. Certain prior period amounts have been reclassified between segments to conform to the current period presentation.
Business Segments
At and for the Year Ended December 31
Consumer and
Total Corporation Commercial Banking(1)
(Dollars in millions)
2003 2002 2001 2003 2002 2001
Net interest income (fully taxable-equivalent basis)
$22,107 $21,511 $20,633 $15,970 $15,205 $13,866
Noninterest income(2)
16,422 13,571 14,348 10,333 8,411 7,773
Total revenue
38,529 35,082 34,981 26,303 23,616 21,639
Provision for credit losses
2,839 3,697 4,287 2,062 1,806 1,580
Gains on sales of debt securities
941 630 475 12 45 3
Amortization of intangibles(3)
217 218 878 179 175 633
Other noninterest expense
19,909 18,218 19,831 12,301 11,301 10,702
Income before income taxes
16,505 13,579 10,460 11,773 10,379 8,727
Income tax expense
5,695 4,330 3,668 4,252 3,836 3,371
Net income
$10,810 $9,249 $ 6,792 $7,521 $6,543 $ 5,356
Period-end total assets
$736,445 $660,951 $386,330 $339,976
Global Corporate and
Asset Management(1) Investment Banking(1)
(Dollars in millions)
2003 2002 2001 2003 2002 2001
Net interest income (fully taxable-equivalent basis)
$754 $752 $ 764 $4,825 $4,797 $ 4,605
Noninterest income(2)
1,880 1,626 1,734 4,108 3,880 4,890
Total revenue
2,634 2,378 2,498 8,933 8,677 9,495
Provision for credit losses
1318 123 477 1,208 1,292
Losses on sales of debt securities
––– (14) (97) (45)
Amortization of intangibles(3)
6657 28 32 143
Other noninterest expense
1,608 1,488 1,504 5,407 5,031 5,319
Income before income taxes
1,019 566 814 3,007 2,309 2,696
Income tax expense
349 191 295 995 748 853
Net income
$670 $375 $ 519 $2,012 $1,561 $ 1,843
Period-end total assets
$27,540 $25,645 $248,833 $220,241
Equity Investments(1) Corporate Other
(Dollars in millions)
2003 2002 2001 2003 2002 2001
Net interest income (fully taxable-equivalent basis)
$(160) $(165) $ (156) $718 $922 $ 1,554
Noninterest income(2)
(94) (281) 179 195 (65) (228)
Total revenue
(254) (446) 23 913 857 1,326
Provision for credit losses(4)
25 78 274 358 1,284
Gains on sales of debt securities
–––943 682 517
Amortization of intangibles(3)
3310 1235
Other noninterest expense(4)
108 88 203 485 310 2,103
Income before income taxes
(390) (544) (198) 1,096 869 (1,579)
Income tax expense (benefit)
(141) (213) (79) 240 (232) (772)
Net income
$(249) $(331) $ (119) $856 $1,101 $ (807)
Period-end total assets
$6,251 $6,064 $67,491 $69,025
(1) There were no material intersegment revenues among the segments.
(2) Noninterest income in 2001 included the $83 SFAS 133 transition adjustment net loss which was recorded in trading account profits. The components of the transition adjustment by segment were a
gain of $4 for Consume r and Comme rcial Banking,a gain of $19 for Global Corpo rate and Inve s tme nt Banking and a loss of $106 for Corporate Othe r.
(3) The Corporation adopted SFAS 142 on January 1, 2002. Accordingly, no goodwill amortization was recorded in 2003 and 2002.
(4) Corporate Othe r includes exit charges consisting of provision for credit losses of $395 and noninterest expense of $1,305 related to the exit of certain consumer finance businesses in 2001.