Bank of America 2003 Annual Report Download - page 32
Download and view the complete annual report
Please find page 32 of the 2003 Bank of America annual report below. You can navigate through the pages in the report by either clicking on the pages listed below, or by using the keyword search tool below to find specific information within the annual report.-
 1
1 -
2
-
3
-
4
-
5
-
6
-
7
-
8
-
9
-
10
-
11
-
12
-
13
-
14
-
15
-
16
-
17
-
18
-
19
-
20
-
21
-
 22
22 -
 23
23 -
 24
24 -
 25
25 -
 26
26 -
 27
27 -
 28
28 -
 29
29 -
 30
30 -
 31
31 -
 32
32 -
 33
33 -
 34
34 -
 35
35 -
 36
36 -
 37
37 -
 38
38 -
 39
39 -
 40
40 -
 41
41 -
 42
42 -
43
-
44
-
45
-
46
-
47
-
48
-
49
-
50
-
51
-
52
-
53
-
54
-
55
-
56
-
57
-
58
-
59
-
60
-
61
 |
 |

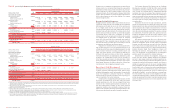
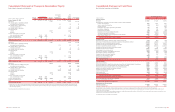
Table II
Analysis of Changes in Net Interest Income – Fully Taxable-equivalent Basis
From 2002 to 2003 From 2001 to 2002
Due to Change in(1) Net Due to Change in(1) Net
(Dollars in millions)
Volume Rate Change Volume Rate Change
Increase (decrease) in interest income
Time deposits placed and other short-term investments
$(24) $ (47) $ (71) $157 $ (232) $ (75)
Federal funds sold and securities purchased under agreements to resell
636 (133) 503 421 (965) (544)
Trading account assets
855 (722) 133 723 (516) 207
Debt securities
(169) (708) (877) 930 (591) 339
Loans and leases:
Commercial – domestic
(717) 318 (399) (1,759) (750) (2,509)
Commercial – foreign
(147) (64) (211) (311) (432) (743)
Commercial real estate – domestic
(70) (123) (193) (238) (419) (657)
Commercial real estate – foreign
(4) (1) (5) 5(8) (3)
Total commercial
(808) (3,912)
Residential mortgage
1,976 (1,527) 449 1,147 (644) 503
Home equity lines
5(178) (173) 58 (470) (412)
Direct/Indirect consumer
166 (347) (181) (9) (312) (321)
Consumer finance
(297) (39) (336) (1,390) 4 (1,386)
Credit card
697 (6) 691 538 (222) 316
Foreign consumer
(1) (5) (6) (10) (43) (53)
Total consumer
444 (1,353)
Total loans and leases
(364) (5,265)
Other earning assets
1,032 (820) 212 2(550) (548)
Total interest income
$(464) $(5,886)
Increase (decrease) in interest expense
Domestic interest-bearing deposits:
Savings
19 (49) (30) 15 (90) (75)
NOW and money market deposit accounts
180 (313) (133) 376 (1,505) (1,129)
Consumer CDs and IRAs
116 (300) (184) (353) (532) (885)
Negotiated CDs, public funds and other time deposits
103 (101) 2 (80) (82) (162)
Total domestic interest-bearing deposits
(345) (2,251)
Foreign interest-bearing deposits:
Banks located in foreign countries
(43) 4 (39) (359) (252) (611)
Governments and official institutions
(2) (10) (12) (54) (55) (109)
Time, savings and other
4(134) (130) (148) (333) (481)
Total foreign interest-bearing deposits
(181) (1,201)
Total interest-bearing deposits
(526) (3,452)
Federal funds purchased, securities sold under agreements
to repurchase and other short-term borrowings
877 (1,015) (138) 530 (2,608) (2,078)
Trading account liabilities
222 (197) 25 62 44 106
Long-term debt
91 (512) (421) (196) (1,144) (1,340)
Total interest expense
(1,060) (6,764)
Net increase in net interest income
$596 $878
(1) The changes for each category of interest income and expense are divided between the portion of change attributable to the variance in volume or rate for that category. The change in rate/volume
variance has been allocated to the rate variance.
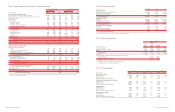
Table III
Core Net Interest Income(1)
(Dollars in millions)
2003 2002 2001
Net interest income
As reported on a fully taxable-equivalent basis
$22,107 $21,511 $ 20,633
Trading-related net interest income
(2,214) (1,976) (1,609)
Impact of revolving securitizations
312 523 695
Core net interest income
$20,205 $20,058 $ 19,719
Average earning assets
As reported
$657,503 $573,521 $ 560,316
Trading-related earning assets
(182,030) (125,656) (102,111)
Impact of revolving securitizations
3,342 6,292 10,112
Core average earning assets
$478,815 $454,157 $ 468,317
Net interest yield on earning assets
As reported
3.36% 3.75% 3.68%
Impact of trading-related activities
0.83 0.61 0.47
Impact of revolving securitizations
0.03 0.05 0.06
Core net interest yield on earning assets
4.22% 4.41% 4.21%
(1) Certain prior period amounts have been reclassified to conform to current period presentation.
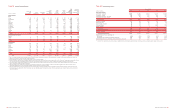
Table IV
Selected Loan Maturity Data(1)
December 31, 2003
Due After
Due in 1 Year
1 Year Through Due After
(Dollars in millions)
or Less 5 Years 5 Years Total
Commercial – domestic
$32,229 $39,126 $20,136 $ 91,491
Commercial real estate – domestic
8,045 8,963 2,035 19,043
Foreign(2)
10,214 2,414 417 13,045
Total selected loans
$50,488 $50,503 $22,588 $123,579
Percent of total
40.8% 40.9% 18.3% 100.0%
Sensitivity of loans to changes in interest rates for loans due after one year:
Fixed interest rates
$6,744 $10,676
Floating or adjustable interest rates
43,759 11,912
Total
$50,503 $22,588
(1) Loan maturities are based on the remaining maturities under contractual terms.
(2) Loan maturities include consumer and commercial foreign loans.
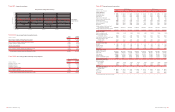
Table V
Short-term Borrowings
2003 2002 2001
(Dollars in millions) Amount Rate Amount Rate Amount Rate
Federal funds purchased
At December 31
$2,356 0.84% $5,167 1.15% $ 5,487 1.45%
Average during year
5,736 1.10 5,470 1.63 6,267 3.99
Maximum month-end balance during year
7,877 – 9,663 – 8,718 –
Securities sold under agreements to repurchase
At December 31
75,690 1.12 59,912 1.44 42,240 1.25
Average during year
102,074 1.15 67,751 1.73 54,826 4.01
Maximum month-end balance during year
124,746 – 99,313 – 70,674 –
Commercial paper
At December 31
7,605 1.09 114 1.20 1,558 1.99
Average during year
2,976 1.29 1,025 1.73 4,156 4.91
Maximum month-end balance during year
9,136 – 1,946 – 7,410 –
Other short-term borrowings
At December 31
34,873 1.76 25,120 1.29 20,659 2.13
Average during year
36,794 1.84 29,907 2.71 27,227 5.56
Maximum month-end balance during year
51,916 – 41,235 – 39,391 –
60 BANK OF AMERICA 2003 BANK OF AMERICA 2003 61