Bank of America 2003 Annual Report Download - page 33
Download and view the complete annual report
Please find page 33 of the 2003 Bank of America annual report below. You can navigate through the pages in the report by either clicking on the pages listed below, or by using the keyword search tool below to find specific information within the annual report.-
 1
1 -
2
-
3
-
4
-
5
-
6
-
7
-
8
-
9
-
10
-
11
-
12
-
13
-
14
-
15
-
16
-
17
-
18
-
19
-
20
-
21
-
22
-
 23
23 -
 24
24 -
 25
25 -
 26
26 -
 27
27 -
 28
28 -
 29
29 -
 30
30 -
 31
31 -
 32
32 -
 33
33 -
 34
34 -
 35
35 -
 36
36 -
 37
37 -
 38
38 -
 39
39 -
 40
40 -
 41
41 -
 42
42 -
 43
43 -
44
-
45
-
46
-
47
-
48
-
49
-
50
-
51
-
52
-
53
-
54
-
55
-
56
-
57
-
58
-
59
-
60
-
61
 |
 |

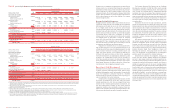
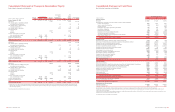
Table VI
Long-term Debt and Other Obligations
December 31, 2003
Due After Due After
Due in 1 Year 3 Years
1 Year Through Through Due After
(Dollars in millions)
or Less 3 Years 5 Years 5 Years Total
Long-term debt and capital leases(1)
$12,193 $17,606 $ 9,297 $36,247 $ 75,343
Purchase obligations(2)
14,074 1,104 791 955 16,924
Operating lease obligations
1,308 2,410 2,146 3,519 9,383
Other long-term liabilities
87 – – – 87
Total
$27,662 $21,120 $12,234 $40,721 $101,737
(1) Includes principal payments only and capital lease obligations of $26.
(2) Obligations that are legally binding agreements whereby we agree to purchase products or services with a specific minimum quantity defined at a fixed, minimum or variable price over a specified period
of time are defined as purchase obligations.
Table VII
Credit Extension Commitments
December 31, 2003
Expires Expires
After After
Expires in 1 Year 3 Years Expires
1 Year Through Through After
(Dollars in millions)
or Less 3 Years 5 Years 5 Years Total
Loan commitments(1)
$80,563 $55,125 $ 25,634 $50,459 $211,781
Standby letters of credit and financial guarantees
19,077 7,662 828 3,583 31,150
Commercial letters of credit
2,973 92 5 190 3,260
Legally binding commitments
102,613 62,879 26,467 54,232 246,191
Credit card lines
84,940 8,831 – – 93,771
Total
$187,553 $71,710 $ 26,467 $ 54,232 $339,962
(1) Equity commitments of $1,678 related to obligations to fund existing equity investments were included in loan commitments at December 31, 2003.
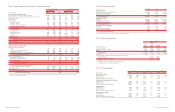
Table VIII
Outstanding Loans and Leases
December 31
2003 2002 2001 2000 1999
(Dollars in millions)
Amount Percent Amount Percent Amount Percent Amount Percent Amount Percent
Commercial – domestic
$96,644 26.0% $105,053 30.6% $118,205 35.9% $146,040 37.2% $143,450 38.7%
Commercial – foreign
15,293 4.1 19,912 5.8 23,039 7.0 31,066 7.9 27,978 7.5
Commercial real estate – domestic
19,043 5.1 19,910 5.8 22,271 6.8 26,154 6.7 24,026 6.5
Commercial real estate – foreign
324 0.1 295 0.1 383 0.1 282 0.1 325 0.1
Total commercial
131,304 35.3 145,170 42.3 163,898 49.8 203,542 51.9 195,779 52.8
Residential mortgage
140,513 37.8 108,197 31.6 78,203 23.8 84,394 21.5 81,860 22.1
Home equity lines
23,859 6.4 23,236 6.8 22,107 6.7 21,598 5.5 17,273 4.7
Direct/Indirect consumer
33,415 9.0 31,068 9.1 30,317 9.2 29,859 7.6 31,997 8.6
Consumer finance
5,589 1.5 8,384 2.4 12,652 3.9 36,398 9.3 32,490 8.8
Credit card
34,814 9.4 24,729 7.2 19,884 6.0 14,094 3.6 9,019 2.4
Foreign consumer
1,969 0.6 1,971 0.6 2,092 0.6 2,308 0.6 2,244 0.6
Total consumer
240,159 64.7 197,585 57.7 165,255 50.2 188,651 48.1 174,883 47.2
Total(1)
$371,463 100.0% $342,755 100.0% $329,153 100.0% $392,193 100.0% $370,662 100.0%
(1) Includes lease financings of $11,376, $14,332, $18,726, $22,486, and $22,671 at December 31, 2003, 2002, 2001, 2000 and 1999, respectively.
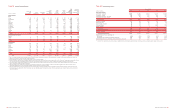
Table IX
Non-real Estate Outstanding Commercial Loans and Leases by Significant Industry(1)
December 31
(Dollars in millions)
2003 2002
Retailing
$11,474 $10,572
Education and government
7,874 5,624
Transportation
7,715 8,030
Leisure and sports, hotels and restaurants
7,477 8,139
Food, beverage and tobacco
6,942 7,335
Diversified financials
6,469 8,344
Capital goods
5,729 7,088
Materials
5,704 7,972
Commercial services and supplies
5,701 6,449
Health care equipment and services
4,052 3,912
Religious and social organizations
2,975 2,426
Media
2,821 5,911
Utilities
2,635 5,590
Energy
2,516 3,076
Consumer durables and apparel
2,161 2,591
Telecommunications services
1,967 3,105
Food and staples retailing
1,364 1,344
Technology hardware and equipment
1,260 1,368
Banks
1,199 1,881
Automobiles and components
1,029 1,024
Software and services
948 908
Insurance
840 1,616
Other(2)
21,085 20,660
Total
$111,937 $124,965
(1) Certain prior period amounts have been reclassified to conform to current period presentation.
(2) At December 31, 2003 and 2002, Other included $10,510 and $9,090, respectively, of loans outstanding to Individuals and Trusts, representing 2.8 percent and 2.7 percent of total outstanding loans
and leases, respectively. The remaining balance in Other included loans to industries that included pharmaceuticals and biotechnology, and household and personal products.
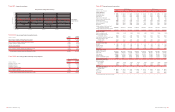
Table X
Outstanding Commercial Real Estate Loans(1)
December 31
(Dollars in millions)
2003 2002
By Geographic Region(2)
California
$4,994 $4,769
Southwest
2,737 2,945
Florida
2,316 2,424
Northwest
2,068 2,067
Carolinas
1,437 1,324
Midwest
1,432 1,696
Mid-Atlantic
1,432 1,332
Midsouth
1,055 1,166
Geographically diversified
639 1,075
Northeast
490 667
Other states
443 445
Non-U.S.
324 295
Total
$19,367 $20,205
By Property Type
Residential
$3,631 $3,153
Office buildings
3,431 3,978
Apartments
3,411 3,556
Shopping centers/retail
2,295 2,549
Industrial/warehouse
1,790 1,898
Land and land development
1,494 1,309
Multiple use
560 718
Hotels/motels
548 853
Miscellaneous commercial
204 378
Other
2,003 1,813
Total
$19,367 $20,205
(1) Certain prior period amounts have been reclassified to conform to current period presentation.
(2) Distribution is based on geographic location of collateral.
62 BANK OF AMERICA 2003 BANK OF AMERICA 2003 63