Bank of America 2003 Annual Report Download - page 27
Download and view the complete annual report
Please find page 27 of the 2003 Bank of America annual report below. You can navigate through the pages in the report by either clicking on the pages listed below, or by using the keyword search tool below to find specific information within the annual report.-
 1
1 -
2
-
3
-
4
-
5
-
6
-
7
-
8
-
9
-
10
-
11
-
12
-
13
-
14
-
15
-
16
-
 17
17 -
 18
18 -
 19
19 -
 20
20 -
 21
21 -
 22
22 -
 23
23 -
 24
24 -
 25
25 -
 26
26 -
 27
27 -
 28
28 -
 29
29 -
 30
30 -
 31
31 -
 32
32 -
 33
33 -
 34
34 -
 35
35 -
 36
36 -
 37
37 -
38
-
39
-
40
-
41
-
42
-
43
-
44
-
45
-
46
-
47
-
48
-
49
-
50
-
51
-
52
-
53
-
54
-
55
-
56
-
57
-
58
-
59
-
60
-
61
 |
 |

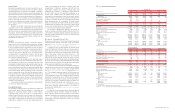
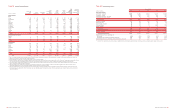
higher bankruptcy filings. General reserves on loans and leases at
December 31, 2003 were $1.2 billion, up $223 million from
December 31, 2002, reflecting the uncertainty around the extent and
depth of the domestic recovery, the impact of rising interest rates on
sectors of the portfolio, the uncertainty in the global arena and con-
tinued exposure to large single name defaults or event risk. The
reserve for unfunded lending commitments decreased $77 million
between December 31, 2003 and December 31, 2002 due to
improvements in the overall commercial credit quality. Given our over-
all assessment of probable losses in the portfolio, the allowance for
credit losses was reduced by $272 million from December 31, 2002.
Problem Loan Management
SSI was established in 2001 to better align the management of com-
mercial loan credit workout operations by providing more effective and
efficient management processes afforded by a closely aligned end-to-
end function. We believe that economic returns will be maximized by
assisting distressed companies in refinancing with other lenders or
through the capital markets, facilitating the sale of the entire company
or certain assets/subsidiaries, negotiating traditional restructurings
using company cash flows to repay debts, selling individual assets in
the secondary market when the market prices are attractive relative to
assessed collateral values and by executing collateralized debt obli-
gations or otherwise disposing of assets in bulk. From time to time,
we may contribute or sell certain loans to SSI.
In September 2001, Bank of America, N.A. contributed to SSI
commercial loans with a gross book balance of $3.2 billion in
exchange for a class of preferred and for a class of common stock of
SSI. For financial reporting under GAAP,the loan contribution was
accounted for at carryover book basis as appropriate for entities
under common control, and there was no change in the designation
or measurement of the loans because the individual loan resolution
strategies were not affected by the realignment or contribution. From
time to time, management may identify certain loans to be consid-
ered for accelerated disposition. At that time, such loans or pools of
loans would be redesignated as held for sale and remeasured at the
lower of cost or market.
The loan contribution was effected as an exchange for tax pur-
poses. As is common in workout situations, the loans had a tax basis
higher than their fair market value. Under the Internal Revenue Code
(the Code), SSI received a carryover tax basis in the contributed
loans. In addition, under the Code, the aggregate tax basis of the
class of preferred and the class of common stock received in the
exchange was equal to the basis of the loans contributed. Under the
Code, the preferred stock’s allocated tax basis was equal to its fair
market value and the common stock was allocated the remaining tax
basis, resulting in a tax basis in excess of its fair market value and
book basis. We took into account the tax loss that resulted from the
difference in tax basis and fair market value, recognized on the sale
of this class of common stock to an unrelated third party, as well as
the carryover tax basis in the contributed loans. We believe that
recognition of the tax loss continues to be appropriate.
During 2003 and 2002, Bank of America, N.A. sold commercial
loans with a gross book balance of approximately $3.0 billion
and $2.7 billion, respectively, to SSI. For tax purposes, under the
Code, the sales were treated as a taxable exchange. The tax and
accounting treatment of these sales had no financial statement
impact on us because the sales were transfers among entities under
common control, and there was no change in the individual loan
resolution strategies.
Market Risk Management
Market risk is the potential loss due to adverse changes in the mar-
ket value or yield of a position. This risk is inherent in the financial
instruments associated with our operations and/or activities includ-
ing loans, deposits, securities, short-term borrowings, long-term debt,
trading account assets and liabilities, and derivatives. Market-sensi-
tive assets and liabilities are generated through loans and deposits
associated with our traditional banking business, our customer and
proprietary trading operations, our ALM process, credit risk manage-
ment, and mortgage banking activities.
Our traditional banking loan and deposit products are nontrad-
ing positions and are not reported at market value but instead are
reported at amortized cost for assets or the amount owed for liabili-
ties (historical cost). While the accounting rules require an historical
cost view of traditional banking assets and liabilities, these positions
are still subject to changes in economic value based on varying mar-
ket conditions. Interest rate risk is the effect of changes in the eco-
nomic value of our loans and deposits, as well as our other interest
rate sensitive instruments, and is reflected in the levels of future
income and expense produced by these positions versus levels that
would be generated by current levels of interest rates. We seek to
mitigate interest rate risk as part of the ALM process.
We seek to mitigate trading risk within our prescribed risk
appetite using hedging techniques. Trading positions are reported at
estimated market value with changes reflected in income. Trading
positions are subject to various risk factors, which include exposures
to interest rates and foreign exchange rates, as well as equity, mort-
gage, commodity and issuer risk factors. We seek to mitigate these
risk exposures by utilizing a variety of financial instruments. The fol-
lowing discusses the key risk components along with respective risk
mitigation techniques.
Inte re st Rate Risk
Interest rate risk represents exposures we have to instruments
whose values vary with the level of interest rates. These instruments
include, but are not limited to, loans, deposits, bonds, futures, for-
wards, options and other derivative instruments. We seek to mitigate
risks associated with the exposures in a variety of ways that typically
involve taking offsetting positions in cash or derivative markets. The
cash and derivative instruments allow us to seek to mitigate risks by
reducing the effect of movements in the level of interest rates,
changes in the shape of the yield curve as well as changes in inter-
est rate volatility. Hedging instruments used to mitigate these risks
include related derivatives – options, futures, forwards, swaps, swap-
tions, and caps and floors.
Fo re ign Exc hange Risk
Foreign exchange risk represents exposures we have to changes in
the values of current holdings and future cash flows denominated in
other currencies. The types of instruments exposed to this risk
include investments in foreign subsidiaries, foreign currency-denomi-
nated loans, foreign currency-denominated securities, future cash
flows in foreign currencies arising from foreign exchange transac-
tions, and various foreign exchange derivative instruments whose val-
ues fluctuate with changes in currency exchange rates or foreign
interest rates. Instruments used to mitigate this risk are foreign
exchange options, futures, forwards and deposits. These instruments
help insulate us against losses that may arise due to volatile move-
ments in foreign exchange rates or interest rates.
Mortgage Risk
Our exposure to mortgage risk takes several forms. First, we trade and
engage in market-making activities in a variety of mortgage securities,
including whole loans, pass-through certificates, commercial mort-
gages, and collateralized mortgage obligations. Second, we originate
a variety of asset-backed securities, which involves the accumulation
of mortgage-related loans in anticipation of eventual securitization.
Third, we may hold positions in mortgage securities and residential
mortgage loans as part of the ALM portfolio. These activities generate
market risk since these instruments are sensitive to changes in the
level of market interest rates, changes in mortgage prepayments and
interest rate volatility. Options, futures, forwards, swaps, swaptions
and U.S. Treasury securities are used to hedge mortgage risk by seek-
ing to mitigate the effects of changes in interest rates.
Equity Marke t Risk
Equity market risk arises from exposure to securities that represent
an ownership interest in a corporation in the form of common stock or
other equity-linked instruments. The instruments held that would lead
to this exposure include, but are not limited to, the following: common
stock, listed equity options (puts and calls), over-the-counter equity
options, equity total return swaps, equity index futures and convertible
bonds. We seek to mitigate the risk associated with these securities
via portfolio hedging that focuses on reducing volatility from changes
in stock prices. Instruments used for risk mitigation include options,
futures, swaps, convertible bonds and cash positions.
Commodity Risk
Commodity risk represents exposures we have to products traded in
the petroleum, natural gas and power markets. Our principal exposure
to these markets emanates from customer-driven transactions. These
transactions consist primarily of futures, forwards, swaps and options.
We seek to mitigate exposure to the commodity markets with instru-
ments including, but not limited to, options, futures and swaps in the
same or similar commodity product, as well as cash positions.
Issue r Risk
Our trading portfolio is exposed to issuer risk where the value of a
trading account asset may be adversely impacted for various reasons
directly related to the issuer, such as management performance,
financial leverage or reduced demand for the issuer’s goods or serv-
ices. Perceived changes in the creditworthiness of a particular debtor
or sector can have significant effects on the replacement costs of
both cash and derivative positions. We seek to mitigate the impact of
credit spreads, credit migration and default risks on the market value
of the trading portfolio with the use of credit default swaps, and credit
fixed income and similar securities.
Trading Risk Management
Trading-related revenues represent the amount earned from our trad-
ing positions, which include trading account assets and liabilities,
derivative positions and mortgage banking assets. Trading positions
are taken in a diverse range of financial instruments and markets,
and are reported at fair value. For more information on fair value, see
Complex Accounting Estimates and Principles on page 30. Trading
account profits can be volatile and are largely driven by general mar-
ket conditions and customer demand. Trading account profits are
dependent on the volume and type of transactions, the level of risk
assumed, and the volatility of price and rate movements at any given
time within the ever-changing market environment.
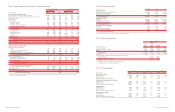
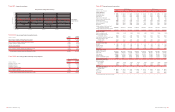
The histogram of daily revenue or loss below is a simple graphic
depicting trading volatility and tracking success of trading-related rev-
enue for 2003. Trading-related revenue encompasses both propri-
etary trading and customer-related activities. In 2003, positive
trading-related revenue was recorded for 88 percent of trading days.
Furthermore, only four percent of the total trading days had losses
greater than $10 million, and the largest loss was $41 million. This
can be compared to 2002 and 2001 as follows:
■
In 2002, positive trading-related revenue was recorded for 86
percent of trading days and only five percent of the total trad-
ing days had losses greater than $10 million. The largest loss
realized in 2002 was $32 million.
■
In 2001, positive trading-related revenue was recorded for 88
percent of trading days and only four percent of the total trad-
ing days had losses greater than $10 million. The largest loss
realized in 2001 was $58 million.
50 BANK OF AMERICA 2003 BANK OF AMERICA 2003 51
Revenue
Number of Days
(Dollars in millions)
Histogram of Daily Trading-related Revenue
Twelve Months Ended December 31, 2003
<-50 -50 > < -40 -40 > < -30 -30 > < -20 -20 > < -10 -10 > < 0 0 > < 10 10 > < 20 20 > < 30 30 > < 40 40 > < 50 > 50
0
30
60
80
70
50
40
20
10