Bank of America 2003 Annual Report Download - page 25
Download and view the complete annual report
Please find page 25 of the 2003 Bank of America annual report below. You can navigate through the pages in the report by either clicking on the pages listed below, or by using the keyword search tool below to find specific information within the annual report.-
 1
1 -
2
-
3
-
4
-
5
-
6
-
7
-
8
-
9
-
10
-
11
-
12
-
13
-
14
-
 15
15 -
 16
16 -
 17
17 -
 18
18 -
 19
19 -
 20
20 -
 21
21 -
 22
22 -
 23
23 -
 24
24 -
 25
25 -
 26
26 -
 27
27 -
 28
28 -
 29
29 -
 30
30 -
 31
31 -
 32
32 -
 33
33 -
 34
34 -
 35
35 -
36
-
37
-
38
-
39
-
40
-
41
-
42
-
43
-
44
-
45
-
46
-
47
-
48
-
49
-
50
-
51
-
52
-
53
-
54
-
55
-
56
-
57
-
58
-
59
-
60
-
61
 |
 |

Foreign Portfolio
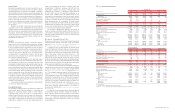
Table 12 sets forth total foreign exposure broken out by region at
December 31, 2003 and 2002. Total foreign exposure is defined to
include credit exposure plus securities and other investments for all
exposure with a country of risk other than the United States.
Table 12
Regional Foreign Exposure and Selected
Emerging Markets Exposure(1,2)
December 31
(Dollars in millions)
2003 2002
Regional Foreign Exposure
Asia
$13,605 $13,912
Europe
49,532 43,034
Africa
108 80
Middle East
584 435
Latin America
4,974 3,915
Other(3)
9,998 8,709
Total
$78,801 $70,085
Selected Emerging Markets(4)
Asia
$11,012 $10,296
Central and Eastern Europe
270 364
Latin America
4,974 3,915
Total
$16,256 $14,575
(1) The balances above do not reflect the netting of local funding or liabilities against local
exposures as allowed by the Federal Financial Institutions Examinations Council (FFIEC).
(2) Exposures for Asia and Latin America have been reduced by $12 and $173, respectively,
at December 31, 2003, and $12 and $763, respectively, at December 31, 2002. Such amounts
represent the fair value of U.S. Treasury securities held as collateral outside the country of
exposure.
(3) Other includes Australia, Bermuda, Canada, Cayman Islands, New Zealand and supranational
entities.
(4) There is no generally accepted definition of emerging markets. The definition that we used
included all countries in Asia excluding Japan; all countries in Latin America excluding Cayman
Islands and Bermuda; and all countries in Central and Eastern Europe except Greece.
Our total foreign exposure was $78.8 billion at December 31, 2003,
an increase of $8.7 billion from December 31, 2002. Our foreign
exposure was concentrated in Europe, which accounted for $49.5 bil-
lion, or 63 percent, of total foreign exposure. Growth in exposure in
Europe during 2003 took place in Western Europe and was distrib-
uted across a variety of industries with the largest concentration in
the banking sector that accounted for approximately 63 percent of
the growth. At December 31, 2003 and 2002, the United Kingdom
and Germany were the only countries whose total cross-border out-
standings exceeded 0.75 percent of our total assets. The United
Kingdom had total cross-border exposure of $10.1 billion and $9.4
billion, respectively, representing 1.37 percent and 1.42 percent of
total assets, respectively. At December 31, 2003 and 2002, Germany
had total cross-border exposure of $6.9 billion and $5.8 billion,
respectively, representing 0.93 percent and 0.87 percent of total
assets, respectively. The bulk of the exposure to both of these coun-
tries was concentrated in the banking sector.
At December 31, 2003, foreign exposure to entities in countries
defined as emerging markets increased 12 percent to $16.3 billion,
or 21 percent of total foreign exposure, compared to $14.6 billion or
21 percent of total exposure at the end of 2002. At December 31,
2003, 68 percent of the emerging markets exposure was in Asia
compared to 71 percent at December 31, 2002. Growth in Asian
emerging markets was largely concentrated in South Korea due to
increases in short-term trade financing. India also contributed to
growth in Asian emerging markets with increases in acceptances and
trading of Indian government securities. A decline in Singapore due
to a decrease in client activity partially offset this growth.
Growth in Latin America was attributable to the acquisition of
24.9 percent of the Mexican entity GFSS in the first quarter of 2003
for $1.6 billion. This growth was partially offset by a reduction in
Mexican Brady Bonds that were called during the second quarter of
2003 as well as reductions in loans and trading activity in Brazil and
continued reductions of our exposure in Argentina. Mexico is the only
country in the region where we significantly increased our exposure.
We will continue to participate in trading activities to take advantage
of favorable market conditions.
The primary components of our exposure in Brazil at December 31,
2003 and 2002 were $406 million and $562 million, respectively, of tra-
ditional credit exposure (loans, letters of credit, etc.) and $159 million
and $290 million, respectively, of Brazilian government securities.
Derivatives exposure totaled $7 million at December 31, 2003 com-
pared to $55 million at December 31, 2002. At December 31, 2003
and 2002, the allowance for credit losses related to Brazil consisted of
$76 million and $60 million, respectively, related to traditional credit
exposure. Nonperforming loans in Brazil were $39 million at December
31, 2003 compared to $90 million at December 31, 2002. Net charge-
offs in 2003 totaled $33 million compared to $8 million in 2002.
The primary components of our exposure in Argentina at
December 31, 2003 and 2002, were $144 million and $339 million,
respectively, of traditional credit exposure, and $65 million and $62
million, respectively, of Argentine government securities. Derivatives
exposure totaled $2 million at both December 31, 2003 and 2002.
The allowance for credit losses related to Argentina’s traditional
credit exposure was $104 million and $177 million at December 31,
2003 and 2002, respectively. At December 31, 2003 and 2002,
Argentina nonperforming loans were $107 million and $278 million,
respectively. Net charge-offs in 2003 totaled $82 million compared to
$113 million in 2002.
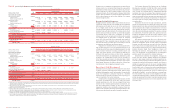
Credit Quality Performance
Overall credit quality continued to improve in 2003 as all major com-
mercial asset quality indicators showed positive trends while con-
sumer credit quality performance remained stable. In 2003,
commercial criticized exposure declined $8.7 billion to $12.7 billion,
as presented in Table 13. Decreases in criticized exposure resulted
from overall improvement in credit quality, paydowns and payoffs that
resulted largely from increased refinancings in the capital markets,
reduced levels of inflows, loan sales and charge-offs. Most of the
decrease in 2003 was in our large corporate portfolio, which was
down $7.0 billion for the year. Reductions were concentrated in the
commercial – domestic product in the utilities, telecommunications
services, media and chemicals industries.
We routinely review the loan and lease portfolio to determine if
any credit exposure should be placed on nonperforming status. An
asset is placed on nonperforming status when it is determined that
principal and interest are not expected to be fully collected in accor-
dance with its contractual terms. As evidenced by the improvement
in credit quality, nonperforming assets, presented in Table 14,
declined $2.2 billion from December 31, 2002 due to decreases in
the nonperforming commercial loan category. Decreases in total non-
performing commercial loans were due to reduced levels of inflows of
$2.8 billion, loan sales of $1.5 billion, paydowns and payoffs of $1.3
billion that resulted from increased refinancings in the capital markets,
improvements in the credit quality of individual exposures and
charge-offs. There are no assurances that the elevated levels of pay-
downs and payoffs experienced in 2003 will continue in 2004. Eighty-
four percent of the reduction in nonperforming commercial loans was
in our large corporate portfolio. Nonperforming commercial – domestic
loans decreased by $1.3 billion and represented 1.56 percent of
commercial – domestic loans at December 31, 2003 compared to
2.65 percent at December 31, 2002. Nonperforming commercial –
foreign loans decreased $773 million and represented 3.83 percent
of commercial – foreign loans at December 31, 2003 compared to
6.83 percent at December 31, 2002.
Within the consumer portfolio, nonperforming loans decreased
$95 million to $638 million, and represented 0.27 percent of con-
sumer loans at December 31, 2003 compared to $733 million, rep-
resenting 0.37 percent of consumer loans at December 31, 2002.
The decrease in nonperforming consumer loans was driven by loan
sales, while the improvement in the percentage of nonperforming
consumer loans to the total consumer portfolio was due to growth in
residential mortgages stemming from our ALM strategies to capitalize
on the large increase of refinancings in the market.
Sales of nonperforming assets in 2003 totaled $1.7 billion,
comprised of $1.5 billion of nonperforming commercial loans, $141
million of nonperforming consumer loans and $123 million of fore-
closed properties. Sales of nonperforming assets in 2002 totaled
$543 million, comprised of $296 million of nonperforming commer-
cial loans, $105 million of nonperforming consumer loans and $142
million of foreclosed properties.
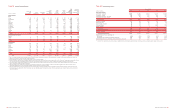
Table 13
Commercial Criticized Exposure(1)
December 31
2003 2002
(Dollars in millions)
Amount Percent(2) Amount Percent(2)
Commercial – domestic
$8,847 6.08% $16,401 10.78%
Commercial – foreign
2,820 6.71 3,804 8.93
Commercial real estate
– domestic
956 3.83 1,150 4.62
Commercial real estate
– foreign
27 8.40 20.79
Total commercial
criticized exposure
$12,650 5.94% $21,357 9.71%
(1) Criticized exposure corresponds to the Special Mention, Substandard and Doubtful asset cate-
gories defined by regulatory authorities. Exposure amounts include loans and leases, foreclosed
properties, letters of credit, bankers’ acceptances, derivatives and assets held for sale.
(2) Commercial criticized exposure is taken as a percentage of total utilized exposure which
includes loans and leases, foreclosed properties, letters of credit, bankers’ acceptances, deriva-
tives and assets held for sale.
Table 14
Nonperforming Assets(1)
December 31
(Dollars in millions)
2003 2002
Commercial – domestic
$1,507 $2,781
Commercial – foreign
586 1,359
Commercial real estate – domestic
140 161
Commercial real estate – foreign
23
Total commercial
2,235 4,304
Residential mortgage
531 612
Home equity lines
43 66
Direct/Indirect consumer
28 30
Consumer finance
32 19
Foreign consumer
46
Total consumer
638 733
Total nonperforming loans
2,873 5,037
Foreclosed properties
148 225
Total nonperforming assets(2)
$3,021 $5,262
(1) In 2003, $575 in interest income was contractually due on nonperforming loans and troubled
debt restructured loans. Of this amount, $141 was actually recorded as interest income in 2003.
(2) Balances do not include $202 and $120 of nonperforming assets included in other assets
at December 31, 2003 and 2002, respectively.
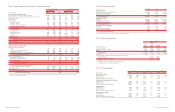
Table 15 presents the additions to and reductions in nonperform-
ing assets in the commercial and consumer portfolios during 2003
and 2002.
Table 15
Nonperforming Assets Activity
(Dollars in millions)
2003 2002
Nonperforming assets, January 1
$5,262 $4,908
Commercial
Additions to nonperforming assets:
New nonaccrual loans and
foreclosed properties
2,134 4,963
Advances on loans
199
244
Total commercial additions
2,333
5,207
Reductions in nonperforming assets:
Paydowns, payoffs and sales
(2,804) (2,171)
Returns to performing status
(197) (149)
Charge-offs(1)
(1,352) (2,354)
Transfers to assets held for sale
(108) –
Total commercial reductions
(4,461) (4,674)
Total commercial net additions to
(reductions in) nonperforming assets
(2,128) 533
Consumer
Additions to nonperforming assets:
New nonaccrual loans and
foreclosed properties
1,583 1,694
Transfers from assets held for sale(2)
5
77
Total consumer additions
1,588 1,771
Reductions in nonperforming assets:
Paydowns, payoffs and sales
(712) (957)
Returns to performing status
(878) (886)
Charge-offs(1)
(111) (107)
Total consumer reductions
(1,701) (1,950)
Total consumer net reductions in
nonperforming assets
(113) (179)
Total net additions to (reductions in)
nonperforming assets
(2,241) 354
Nonperforming assets, December 31
$3,021 $5,262
(1) Certain loan products, including commercial credit card, consumer credit card and consumer
non-real estate loans, are not classified as nonperforming; therefore, the charge-offs on these
loans are not included above.
(2) Includes assets held for sale that were foreclosed and transferred to foreclosed properties.
Domestic commercial loans past due 90 days or more and still accru-
ing interest were $133 million and $223 million at December 31,
2003 and 2002, respectively. Consumer loans past due 90 days or
more and still accruing interest were $698 million and $541 million
at December 31, 2003 and 2002, respectively, which included held
credit card loans of $616 million and $424 million, respectively.
Commercial – domestic loan net charge-offs, as presented in
Table 17, decreased $714 million to $757 million in 2003 compared
to 2002, reflecting overall improvement in the portfolio and to a
lesser extent, reductions in various industry sectors, the largest of
which was telecommunications services.
Commercial – foreign loan net charge-offs were $306 million in
2003 compared to $521 million in 2002. The decrease was attributable
to reductions in exposure to the telecommunications and media industry
sectors. The largest concentration of commercial – foreign loan net
charge-offs in 2003, excluding Parmalat, was attributable to Argentina.
Held credit card net charge-offs increased $420 million to $1.5
billion in 2003 compared to 2002, of which $173 million were from
new advances on previously securitized balances. Such advances are
46 BANK OF AMERICA 2003 BANK OF AMERICA 2003 47