Bank of America 2003 Annual Report Download - page 34
Download and view the complete annual report
Please find page 34 of the 2003 Bank of America annual report below. You can navigate through the pages in the report by either clicking on the pages listed below, or by using the keyword search tool below to find specific information within the annual report.-
 1
1 -
2
-
3
-
4
-
5
-
6
-
7
-
8
-
9
-
10
-
11
-
12
-
13
-
14
-
15
-
16
-
17
-
18
-
19
-
20
-
21
-
22
-
23
-
 24
24 -
 25
25 -
 26
26 -
 27
27 -
 28
28 -
 29
29 -
 30
30 -
 31
31 -
 32
32 -
 33
33 -
 34
34 -
 35
35 -
 36
36 -
 37
37 -
 38
38 -
 39
39 -
 40
40 -
 41
41 -
 42
42 -
 43
43 -
 44
44 -
45
-
46
-
47
-
48
-
49
-
50
-
51
-
52
-
53
-
54
-
55
-
56
-
57
-
58
-
59
-
60
-
61
 |
 |

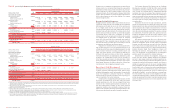
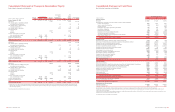
Table XI
Selected Emerging Markets(1)
Total Increase/
Debt Total Gross Foreign (Decrease)
Loans and Securities/ Cross- Local Exposure from
Loan Other Derivative Other border Country December 31, December 31,
(Dollars in millions)
Commitments Financing(2) Assets Investments(3) Exposure(4) Exposure(5) 2003 2002
Region/Country
Asia
China
$49 $23 $82 $45 $ 199 $ 99 $298 $54
Hong Kong(6)
166 19 118 113 416 3,489 3,905 101
India
132 543 61 275 1,011 942 1,953 580
Indonesia
31 – 13 84 128 3 131 11
Malaysia
7232739146 185 (55)
Philippines
22 35 2 55 114 62 176 20
Singapore
189 11 65 13 278 890 1,168 (500)
South Korea
638 636 41 83 1,398 531 1,929 693
Taiwan
226 173 32 – 431 458 889 (200)
Thailand
20 5 16 37 78 173 251 (12)
Other
816 4 –2899127 24
Total
1,488 1,463 437 732 4,120 6,892 11,012 716
Central and Eastern Europe
Poland
–151084109 24 133 (99)
Turkey
83 –1930–30 (28)
Other
16 17 31 43 107 – 107 33
Total
24 35 41 146 246 24 270 (94)
Latin America
Argentina
106 56 2 123 287 56 343 (122)
Brazil
115 217 7 139 478 263 741 (434)
Chile
75 49 5 2 131 – 131 (10)
Colombia
31 14 1 8 54 4 58 (30)
Mexico
556 208 105 1,914 2,783 259 3,042 1,453
Venezuela
93 19 – 144 256 – 256 24
Other
93 75 202 33 403 – 403 178
Total
1,069 638 322 2,363 4,392 582 4,974 1,059
Total
$2,581 $ 2,136 $ 800 $ 3,241 $ 8,758 $ 7,498 $16,256 $1,681
(1) There is no generally accepted definition of emerging markets. The definition that we used included all countries in Asia excluding Japan; all countries in Latin America excluding Cayman Islands and
Bermuda; and all countries in Central and Eastern Europe except Greece.
(2) Includes acceptances, standby letters of credit, commercial letters of credit and formal guarantees.
(3) Amounts outstanding in the table above for Philippines, Argentina, Mexico, Venezuela and Latin America Other have been reduced by $13, $0, $0, $136 and $37, respectively, at December 31, 2003, and
$12, $90, $505, $131 and $37, respectively, at December 31, 2002. Such amounts represent the fair value of U.S. Treasury securities held as collateral outside the country of exposure.
(4) Cross-border exposure includes amounts payable to the Corporation by borrowers with a country of residence other than the one in which the credit is booked, regardless of the currency in which the
claim is denominated, consistent with FFIEC reporting rules.
(5) Gross local country exposure includes amounts payable to the Corporation by borrowers with a country of residence in which the credit is booked, regardless of the currency in which the claim is
denominated. Management does not net local funding or liabilities against local exposures as allowed by the FFIEC.
(6) Gross local country exposure to Hong Kong consisted of $1,911 of consumer loans and $1,578 of commercial exposure at December 31, 2003 compared to $1,828 of consumer loans and $1,572
of commercial exposure at December 31, 2002. The consumer loans were collateralized primarily by residential real estate. The commercial exposure was primarily to local clients and was diversified
across many industries.
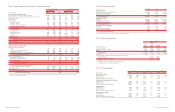
Table XII
Nonperforming Assets(1)
December 31
(Dollars in millions)
2003 2002 2001 2000 1999
Nonperforming loans
Commercial – domestic
$1,507 $2,781 $3,123 $2,777 $1,163
Commercial – foreign
586 1,359 461 486 486
Commercial real estate – domestic
140 161 240 236 191
Commercial real estate – foreign
23333
Total commercial
2,235 4,304 3,827 3,502 1,843
Residential mortgage
531 612 556 551 529
Home equity lines
43 66 80 32 46
Direct/Indirect consumer
28 30 27 19 19
Consumer finance
32 19 9 1,095 598
Foreign consumer
46797
Total consumer
638 733 679 1,706 1,199
Total nonperforming loans
2,873 5,037 4,506 5,208 3,042
Foreclosed properties
148 225 402 249 163
Total nonperforming assets
$3,021 $5,262 $4,908 $5,457 $3,205
Nonperforming assets as a percentage of:
Total assets
0.41% 0.80% 0.79% 0.85% 0.51%
Outstanding loans, leases and foreclosed properties
0.81 1.53 1.49 1.39 0.86
Nonperforming loans as a percentage of outstanding loans and leases
0.77 1.47 1.37 1.33 0.82
(1) In 2003, $575 in interest income was contractually due on nonperforming loans and troubled debt restructured loans. Of this amount, $141 was actually recorded as interest income in 2003.
64 BANK OF AMERICA 2003 BANK OF AMERICA 2003 65