Bank of America 2003 Annual Report Download - page 19
Download and view the complete annual report
Please find page 19 of the 2003 Bank of America annual report below. You can navigate through the pages in the report by either clicking on the pages listed below, or by using the keyword search tool below to find specific information within the annual report.-
 1
1 -
2
-
3
-
4
-
5
-
6
-
7
-
8
-
 9
9 -
 10
10 -
 11
11 -
 12
12 -
 13
13 -
 14
14 -
 15
15 -
 16
16 -
 17
17 -
 18
18 -
 19
19 -
 20
20 -
 21
21 -
 22
22 -
 23
23 -
 24
24 -
 25
25 -
 26
26 -
 27
27 -
 28
28 -
 29
29 -
30
-
31
-
32
-
33
-
34
-
35
-
36
-
37
-
38
-
39
-
40
-
41
-
42
-
43
-
44
-
45
-
46
-
47
-
48
-
49
-
50
-
51
-
52
-
53
-
54
-
55
-
56
-
57
-
58
-
59
-
60
-
61
 |
 |

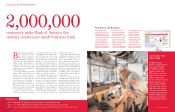
Consumer and Commercial Banking
Our Consume r and Comme rcial Banking strategy is to attract, retain
and deepen customer relationships. A critical component of that
strategy includes continuously improving customer satisfaction. We
believe this focus will help us achieve our goal of being recognized as
the best retail bank in America. Customer satisfaction increased
eight percent at December 31, 2003 compared to December 31,
2002. We added 1.24 million net new checking accounts in 2003,
exceeding the full-year goal of one million and more than doubling
last year’s total net new checking account growth of 528,000. This
growth resulted from the introduction of new products, advancement
of our multicultural strategy and strong customer retention. In 2004,
we anticipate checking account growth to exceed 2003 levels. Access
to our services through online banking, which saw a 52 percent
increase in active online subscribers, our network of domestic bank-
ing centers, card products, ATMs, telephone and Internet channels,
and our product innovations, such as an expedited mortgage appli-
cation process, all contributed to success with our customers.
The major subsegments of Consume r and Comme rcial Banking
are Banking Re gions, Consume r Products and Comme rcial Banking.
Banking Re gions serves consumer households and small busi-
nesses in 21 states and the District of Columbia through its network
of 4,277 banking centers, 13,241 ATMs, telephone and Internet
channels on www.bankofamerica.com. Banking Re gions provides a
wide range of products and services, including deposit products such
as checking accounts, money market savings accounts, time
deposits and IRAs, debit card products and credit products such as
home equity, mortgage and personal auto loans. It also provides
treasury management, credit services, community investment, e-com-
merce and brokerage services to nearly two million small business
relationships across the franchise. Banking Re gions also includes
Pre mie r Banking,which provides high-touch banking, which repre-
sents more direct contact with the client, and investment solutions to
affluent clients with balances up to $3 million.
Consume r Products provides services including the origination,
fulfillment and servicing of residential mortgage loans, issuance and
servicing of credit cards, direct banking via telephone and Internet,
student lending and certain insurance services. Consume r Products
also provides retail finance and floorplan programs to marine, RV and
auto dealerships.
Comme rcial Banking provides commercial lending and treasury
management services primarily to middle-market companies with
annual revenue between $10 million and $500 million. These services
are available through relationship manager teams as well as through
alternative channels such as the telephone via the commercial serv-
ice center and the Internet by accessing Bank of America Direct.
Comme rcial Banking also includes the Real Estate Banking Group,
which provides project financing and treasury management to private
developers, homebuilders and commercial real estate firms across
the U.S. Comme rcial Banking also provides lending and investing serv-
ices to develop low- and moderate-income communities.
Consume r and Comme rcial Banking drove our financial results in
2003 as total revenue increased $2.7 billion, or 11 percent. Net
income rose $1.0 billion, or 15 percent. The increase in net income
and a decrease in the capital charge resulting from the reduction in
the rate used to calculate the charge for the use of capital drove a
$1.1 billion, or 24 percent, increase in SVA.
Net interest income increased $765 million due to overall
deposit and loan portfolio growth. This increase was offset by the
compression of deposit interest margins and the net results of ALM
activities. Net interest income was positively impacted by the $6.2
billion, or three percent, increase in average loans and leases in
2003, compared to 2002, resulting from a $6.3 billion, or six per-
cent, increase in consumer loans. An eight percent increase in aver-
age direct/indirect loans contributed to the growth in the consumer
loan portfolio. Average commercial loans remained relatively
unchanged in 2003.
Deposit growth also positively impacted net interest income.
Higher consumer deposit balances as a result of government tax
cuts, higher customer retention and our efforts to add new cus-
tomers, as evidenced by the increase in net new checking accounts,
drove the $29.3 billion, or 10 percent, increase in average deposits
in 2003.
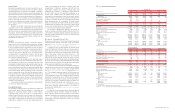
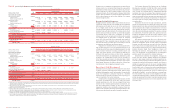
Significant Noninterest Income Components
(Dollars in millions)
2003 2002
Service charges $4,353 $4,069
Mortgage banking income 1,922 761
Card income 3,052 2,620
Trading account profits (losses)
(169) (7)
Increases in both consumer and corporate service charges led to the
$284 million, or seven percent, increase in service charge income.
Consumer service charges increased $247 million, or eight percent,
to $3.2 billion due to favorable repricing and increased levels of
deposit fees from new account growth of $254 million. Corporate
service charges increased $37 million, or three percent, to $1.2 billion
due to a $31 million increase in income from pricing initiatives and
account growth.
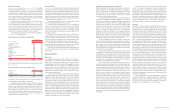
Decreasing mortgage interest rates in the first half of 2003
drove a sharp increase in refinance volumes within the mortgage
industry leading to increases in our loan production and sales
activity. First mortgage loan originations increased $43.1 billion to
$131.1 billion in 2003, resulting from elevated refinancing levels
and broader market coverage from our ongoing deployment of
LoanSolutions
®
,which was first rolled out in the second quarter
of 2002. Total mortgages funded through LoanSolutions
®
totaled
$36.3 billion and $7.3 billion in 2003 and 2002, respectively. First
mortgage loan origination volume was composed of approximately
$91.8 billion of retail loans and $39.3 billion of wholesale loans in
2003, compared to $59.9 billion and $28.1 billion, respectively, in
2002. Increased mortgage prepayments, resulting from the
extended low interest rate environment of 2003, led to a $32.6 bil-
lion net decline in the average portfolio of first mortgage loans
serviced to $250.4 billion in 2003. Increased sales of loans to the
secondary market in 2003, along with improved profit margins
drove the $1.2 billion increase in mortgage banking income. In
2003 and 2002, loan sales to the secondary market were $107.4
billion and $51.6 billion, respectively.
As we have seen interest rates rise from mid-year levels, the
warehouse and pipeline of mortgage loan applications at December
31, 2003 were approximately 70 percent lower compared to June 30,
2003 levels. At current or increased mortgage interest rate levels,
the mortgage industry would be expected to experience a significant
decline in first mortgage origination volume. We are not in a position
to determine the ultimate impact to the mortgage banking industry or
our related business at this time. As industry origination volumes
decline, we believe we can garner market share from increased dis-
tribution, increased advertising and sales productivity; however, we
do expect the decline in industry volumes to negatively impact mort-
gage banking income in 2004 compared to 2003. We also believe
our increased focus on home equity lending will replace a portion of
the drop in mortgage revenue with higher net interest income.
Trading account profits (losses) primarily represent the net
mark-to-market adjustments on mortgage banking assets and related
derivative instruments used as an economic hedge on the assets.
Impacting trading account profits (losses) in 2003 was a net reduc-
tion, including the negative impact of changes in prepayment speeds,
in the value of our mortgage banking assets and related derivative
instruments of $159 million, due to a difference between the change
in the value of our mortgage banking assets and the related deriva-
tives. The value of mortgage banking assets increased to $2.7 billion
at December 31, 2003 compared to $2.1 billion at December 31,
2002 due to new additions from loan sales, offset by normal pay-
downs, amortization and negative mark-to-market adjustments.
Increases in both debit and credit card income resulted in the
16 percent increase in card income. The increase in debit card
income of $111 million, or 14 percent, to $896 million was due to
increases in purchase volumes related to account growth and higher
activation and penetration levels. Credit card income increased $321
million, or 18 percent, resulting from higher interchange fees of $154
million, driven by increased credit card purchase volumes, late fees
of $113 million, overlimit fees of $86 million, cash advance fees of
$43 million and other miscellaneous fees of $95 million offset by
lower excess servicing income of $170 million. Debit card purchase
volumes grew 22 percent while credit card purchases increased 13
percent in 2003 from 2002. Currently, management anticipates that
credit and debit card purchase volumes will continue to increase in
2004. Card income included activity from the securitized portfolio of
$116 million and $157 million in 2003 and 2002, respectively.
Noninterest income, rather than net interest income and provision for
credit losses, is recorded for assets that have been securitized as we
are compensated for servicing the securitized assets and record
servicing income and gains or losses on securitizations, where appro-
priate. New advances on previously securitized accounts will be
recorded on our balance sheet after the revolving period of the secu-
ritization, which has the effect of increasing loans on our balance
sheet and increasing net interest income and charge-offs, with a cor-
responding reduction in noninterest income. Average on-balance
sheet credit card outstandings increased 32 percent, due to over
4 million new accounts and an increase of $2.6 billion in new
advances on previously securitized balances that are recorded on our
balance sheet after the revolving period of the securitization. Average
managed credit card outstandings, which include securitized credit
card loans, increased 15 percent in 2003 due to new account growth
from direct marketing programs and the branch network.
On January 23, 2004, the Federal District Court in the Eastern
District of New York approved Visa U.S.A.’s previously entered into
agreement in principle to settle the class action anti-trust lawsuit filed
against it by Wal-Mart and other retailers (the settlement). Effective
January 1, 2004, the settlement permitted retailers who accept Visa
U.S.A. cards to reject payment from consumers signing for purchases
using their debit card, changing Visa U.S.A.’s longstanding “honor all
cards” policy. In addition, beginning August 1, 2003, interchange fees
charged to retailers were reduced by approximately 30 percent. This
reduction was effective until January 1, 2004, at which time Visa U.S.A.
was free to set competitive rates. The after-tax impact of the reduction
in interchange fees on net income in 2003 was $52 million. While it is
difficult to predict volume and interchange fees, we believe that, on an
after-tax basis, the impact of the reduction in interchange fees will likely
reduce net income by approximately $90 million in 2004.
An increase in provision in the held consumer credit card loan
portfolio of $613 million and declines in provision for other consumer
loans of $239 million and commercial loans of $140 million resulted
in a $256 million, or 14 percent, increase in the provision for credit
losses. The increase in held consumer credit card provision to $1.8
billion was due to increases of $192 million related to higher out-
standings, $173 million from charge-offs of new advances on previ-
ously securitized balances, and $255 million from charge-offs related
to continued seasoning of outstandings from new account growth and
economic conditions, including higher bankruptcies. Seasoning refers
to the length of time passed since an account was opened.
Noninterest expense increased $1.0 billion, or nine percent,
due to increases in data processing costs of $305 million, personnel
expense of $291 million, other general operating expenses of $142
million, marketing and promotional fees of $112 million and occu-
pancy expense of $92 million. Personnel expense increased as a
result of higher incentive compensation of $178 million driven by
increased mortgage sales production. Marketing and promotional
fees were up due to increased advertising and marketing investments
of $105 million in direct marketing for the credit card business.
Asset Management
Asse t Manage me nt provides wealth and investment management
services through three businesses: The Private Bank, which focuses
on high-net-worth individuals and families; Banc of America
Investments (BAI), providing investment and financial planning serv-
ices to individuals; and Banc of America Capital Management
(BACAP), the asset management group serving the needs of institu-
tional clients, high-net-worth individuals and retail customers.
Together, these businesses are focusing on attracting and deepening
client relationships, with the ultimate goal of becoming America’s
advisor of choice. Our strategy is threefold: (i) to continue to expand
distribution capabilities to reach key constituencies and markets; (ii)
to complete the expansion and rollout of integrated wealth manage-
ment models to better serve our clients’ financial needs; and (iii) to
continue to strengthen and develop our full array of investment man-
agement products and services for individuals and institutions. Asse t
Manage me nt exceeded its goal of increasing financial advisors by 20
percent and ended the year with 1,150 financial advisors. In addition,
the Premier Banking and Investments partnership has developed an
integrated financial services model and as a component of the
continued strategic distribution channel expansion opened 10 new
wealth centers. The Private Bank successfully completed the rollout
of its high-net-worth model to all markets. BACAP has experienced
growth in assets under management led by higher market valuations,
sales in assets advised by Marsico and sales in the fee-based assets
of BACAP’s Consulting Services Group.
34 BANK OF AMERICA 2003 BANK OF AMERICA 2003 35