Bank of America 2003 Annual Report Download - page 22
Download and view the complete annual report
Please find page 22 of the 2003 Bank of America annual report below. You can navigate through the pages in the report by either clicking on the pages listed below, or by using the keyword search tool below to find specific information within the annual report.-
 1
1 -
2
-
3
-
4
-
5
-
6
-
7
-
8
-
9
-
10
-
11
-
 12
12 -
 13
13 -
 14
14 -
 15
15 -
 16
16 -
 17
17 -
 18
18 -
 19
19 -
 20
20 -
 21
21 -
 22
22 -
 23
23 -
 24
24 -
 25
25 -
 26
26 -
 27
27 -
 28
28 -
 29
29 -
 30
30 -
 31
31 -
 32
32 -
33
-
34
-
35
-
36
-
37
-
38
-
39
-
40
-
41
-
42
-
43
-
44
-
45
-
46
-
47
-
48
-
49
-
50
-
51
-
52
-
53
-
54
-
55
-
56
-
57
-
58
-
59
-
60
-
61
 |
 |

Liquidity Risk Management
Liquidity Risk
Liquidity is the ongoing ability to accommodate liability maturities and
deposit withdrawals, fund asset growth and meet contractual obliga-
tions through unconstrained access to funding at reasonable market
rates. Liquidity management involves maintaining ample and diverse
funding capacity, liquid assets and other sources of cash to accom-
modate fluctuations in asset and liability levels due to changes in our
business operations or unanticipated events.
We manage liquidity at two primary levels. The first level is the
liquidity of the parent company, which is the holding company that
owns the banking and nonbanking subsidiaries. The second level is
the liquidity of the banking subsidiaries. The management of liquidity
at both levels is essential because the parent company and banking
subsidiaries each have different funding needs and sources, and each
are subject to certain regulatory guidelines and requirements.
Through its subcommittee ALCO, the Finance Committee is responsi-
ble for establishing our liquidity policy as well as approving operating
and contingency procedures and monitoring liquidity on an ongoing
basis. Corporate Treasury is responsible for planning and executing
our funding activities and strategy.
A primary objective of liquidity risk management is to provide a
planning mechanism for unanticipated changes in the demand or need
of liquidity created by customer behavior or capital market conditions.
In order to achieve this objective, liquidity management and business
unit activities are managed consistent with a strategy of funding sta-
bility, flexibility and diversity. We emphasize maximizing and preserving
customer deposits and other customer-based funding sources.
Deposit rates and levels are monitored, and trends and significant
changes are reported to the Finance Committee. Deposit marketing
strategies are reviewed for consistency with our liquidity policy objec-
tives. Asset securitizations also enhance funding diversity and stability
and are considered an additional source of contingency funding.
We develop and maintain contingency funding plans that sepa-
rately address the parent company and banking subsidiaries’ liquidity.
These plans evaluate market-based funding capacity under various
levels of market conditions and specify actions and procedures to be
implemented under liquidity stress. Further, these plans address
alternative sources of liquidity, measure the overall ability to fund our
operations, and define roles and responsibilities for effectively man-
aging liquidity through a problem period.
Our borrowing costs and ability to raise funds are directly
impacted by our credit ratings and changes thereto. The credit ratings
of Bank of America Corporation and Bank of America, National
Association (Bank of America, N.A.) are reflected in the table below.
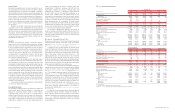
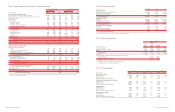
Table 5
Credit Ratings
December 31, 2003
Bank of America Corporation Bank of America, N.A.
Senior Subordinated Commercial Short- Long-
Debt Debt Paper term term
Moody’s
Aa2 Aa3 P-1 P-1 Aa1
S&P
A+ A A-1 A-1+ AA-
Fitch, Inc. AA AA- F1+ F1+ AA+
Primary sources of funding for the parent company include dividends
received from its banking and nonbanking subsidiaries and proceeds
from the issuance of senior and subordinated debt, commercial
paper and equity. Primary uses of funds for the parent company
include repayment of maturing debt and commercial paper, share
repurchases, dividends paid to shareholders, and subsidiary funding
through capital or debt.
Parent company liquidity is maintained at levels sufficient to fund
holding company and nonbank affiliate operations during various stress
scenarios in which access to normal funding sources is disrupted. The
primary measure used in assessing the parent company’s liquidity is
“Time to Required Funding” in a stress environment. This measure
assumes that the parent company is unable to generate funds from
debt or equity issuance, receives no dividend income from subsidiaries,
and no longer pays dividends to shareholders. Projected liquidity
demands are met with available liquidity until the liquidity is exhausted.
Under this scenario, the amount of time which elapses before the cur-
rent liquid assets are exhausted is considered the “Time to Required
Funding”. ALCO approves the target range set for this metric and mon-
itors adherence to the target. In order to remain in the target range, we
use the “Time to Required Funding” measurement to determine the
timing and extent of future debt issuances and other actions.
Primary sources of funding for the banking subsidiaries include
customer deposits, wholesale funding and asset securitizations,
sales and repurchase obligations. Primary uses of funds for the bank-
ing subsidiaries include repayment of maturing obligations and
growth in the ALM and core asset portfolios, including loan demand.
ALCO regularly reviews the funding plan for the banking sub-
sidiaries and focuses on maintaining prudent levels of wholesale bor-
rowing. Also for the banking subsidiaries, expected wholesale
borrowing capacity over a 12-month horizon compared to current out-
standings is evaluated using a variety of business environments.
These environments have differing earnings performance, customer
relationship and ratings scenarios. Funding exposure related to our
role as liquidity provider to certain off-balance sheet financing entities
is also measured under a stress scenario. In this measurement, rat-
ings are downgraded such that the off-balance sheet financing enti-
ties are not able to issue commercial paper and backup facilities that
we provide are drawn upon. In addition, potential draws on credit facil-
ities to issuers with ratings below a certain level are analyzed to
assess potential funding exposure.
Our primary business activities allow us to obtain funds from
our customers in many ways and require us to provide funds to our
customers in many different forms. A key element of our success is
the ability to balance the cash provided from our deposit base and
the capital markets against cash used in our activities.
One ratio used to monitor trends is the “loan to domestic
deposit” (LTD) ratio. The LTD ratio reflects the percent of loans that
could be funded by domestic deposits. A ratio below 100 percent
would indicate that market-based funding would not be needed to
fund new loans; conversely, a ratio above 100 percent would indicate
that market-based funds would be needed to fund new loans. The
ratio was 98 percent for 2003 compared to 97 percent for 2002. For
further discussion see Deposit and Other Funding Sources below.
We originate loans both for retention on our balance sheet and
for distribution. As part of our “originate to distribute” strategy, com-
mercial loan originations are distributed through syndication struc-
tures, and residential mortgages originated by the mortgage group
are frequently distributed in the secondary market. In connection with
our balance sheet management activities, we may retain mortgage
loans originated as well as purchase and sell loans based on our
assessment of market conditions.
Table 6
Average Balance Sheet
(Dollars in millions)
2003 2002
Assets
Time deposits placed and other short-term
investments
$9,056 $10,038
Federal funds sold and securities purchased
under agreements to resell
78,857 45,640
Trading account assets
97,222 79,562
Debt securities
72,267 75,298
Loans and leases
356,148 336,819
Other assets
150,582 115,586
Total assets
$764,132 $662,943
Liabilities and shareholders’ equity
Domestic interest-bearing deposits
$251,307 $225,464
Foreign interest-bearing deposits
35,204 36,549
Short-term borrowings
147,580 104,153
Trading account liabilities
37,176 31,600
Long-term debt(1)
68,432 66,045
Noninterest-bearing deposits
119,722 109,466
Other liabilities
55,507 42,053
Shareholders’ equity
49,204 47,613
Total liabilities and shareholders’ equity
$764,132 $662,943
(1) Includes long-term debt related to Trust Securities.
Deposits and Other Funding Sources
Deposits are a key source of funding. Table
I
beginning on page 58
provides information on the average amounts of deposits and the
rates paid by deposit category. Average deposits increased $34.8 bil-
lion to $406.2 billion in 2003 compared to 2002 due to a $25.8 bil-
lion increase in average domestic interest-bearing deposits and a
$10.3 billion increase in average noninterest-bearing deposits, par-
tially offset by a $1.3 billion decrease in average foreign interest-
bearing deposits. We typically categorize our deposits into either core
or market-based deposits. Core deposits, which are generally cus-
tomer-based, are an important stable, low-cost funding source and
typically react more slowly to interest rate changes than market-
based deposits. Core deposits exclude negotiable CDs, public funds,
other domestic time deposits and foreign interest-bearing deposits.
Average core deposits increased $32.7 billion to $363.4 billion, a
10 percent increase from a year ago. The increase was due to the
growth in money market deposits of $17.1 billion, noninterest-bear-
ing deposits of $10.3 billion, savings of $2.8 billion, and consumer
CDs and IRAs of $2.6 billion due to an emphasis on total relationship
balances and customer preference for stable investments in uncer-
tain economic times. Market-based deposit funding increased
$2.0 billion to $42.8 billion in 2003. The increase was due to a $3.4
billion increase in negotiable CDs, public funds and other domestic
time deposits that was offset by a $1.3 billion decrease in foreign
interest-bearing deposits. Deposits, on average, represented 53
percent and 56 percent of total sources of funds during 2003 and
2002, respectively.
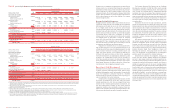
Table 7 summarizes average deposits by category.
Table 7
Average Deposits
(Dollars in millions)
2003 2002
Deposits by type
Domestic interest-bearing:
Savings
$24,538 $21,691
NOW and money market accounts
148,896 131,841
Consumer CDs and IRAs
70,246 67,695
Negotiable CDs and
other time deposits
7,627 4,237
Total domestic interest-bearing
251,307 225,464
Foreign interest-bearing:
Banks located in foreign countries
13,959 15,464
Governments and official institutions
2,218 2,316
Time, savings and other
19,027 18,769
Total foreign interest-bearing
35,204 36,549
Total interest-bearing
286,511 262,013
Noninterest-bearing
119,722 109,466
Total deposits
$406,233 $371,479
Core and market-based deposits
Core deposits
$363,402 $330,693
Market-based deposits
42,831 40,786
Total deposits
$406,233 $371,479
Additional sources of funds include short-term borrowings, long-term
debt and shareholders’ equity. Average short-term borrowings, a rel-
atively low-cost source of funds, were up $43.4 billion to $147.6 bil-
lion for 2003 compared to 2002 due to increases in federal funds
purchased and securities sold under agreements to repurchase of
$34.6 billion and other short-term borrowings of $8.8 billion that
were used to fund asset growth or facilitate trading activities.
Issuances and repayments of long-term debt were $17.2 billion and
$9.3 billion, respectively, for 2003.
Obligations and Commitments
We have contractual obligations to make future payments on debt
and lease agreements. Additionally, in the normal course of busi-
ness, we enter into contractual arrangements whereby we commit to
future purchases of products or services from unaffiliated parties.
Obligations that are legally binding agreements whereby we agree to
purchase products or services with a specific minimum quantity
defined at a fixed, minimum or variable price over a specified period
of time are defined as purchase obligations. Included in purchase
obligations are vendor contracts of $3.5 billion, commitments to pur-
chase securities of $5.1 billion and commitments to purchase loans
of $8.3 billion. The most significant of our vendor contracts include
communication services, marketing and software contracts. Other
long-term liabilities include our obligations related to the Qualified
Pension Plan, Nonqualified Pension Plans and Postretirement Health
and Life Plans (the Plans). Obligations to the Plans are based on the
current and projected obligations of the Plans, performance of the
Plans’ assets and any participant contributions, if applicable. During
2003 and 2002, we contributed $460 million and $823 million,
respectively, to the Plans, and we expect to make at least $87 million
of contributions during 2004. Management believes the effect of the
Plans on liquidity is not significant to our overall financial condition.
Debt and lease obligations are more fully discussed in Note 12 of the
consolidated financial statements.
40 BANK OF AMERICA 2003 BANK OF AMERICA 2003 41