Bank of America 2003 Annual Report Download - page 20
Download and view the complete annual report
Please find page 20 of the 2003 Bank of America annual report below. You can navigate through the pages in the report by either clicking on the pages listed below, or by using the keyword search tool below to find specific information within the annual report.-
 1
1 -
2
-
3
-
4
-
5
-
6
-
7
-
8
-
9
-
 10
10 -
 11
11 -
 12
12 -
 13
13 -
 14
14 -
 15
15 -
 16
16 -
 17
17 -
 18
18 -
 19
19 -
 20
20 -
 21
21 -
 22
22 -
 23
23 -
 24
24 -
 25
25 -
 26
26 -
 27
27 -
 28
28 -
 29
29 -
 30
30 -
31
-
32
-
33
-
34
-
35
-
36
-
37
-
38
-
39
-
40
-
41
-
42
-
43
-
44
-
45
-
46
-
47
-
48
-
49
-
50
-
51
-
52
-
53
-
54
-
55
-
56
-
57
-
58
-
59
-
60
-
61
 |
 |

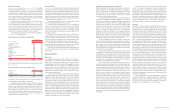
Total revenue increased $256 million, or 11 percent, in 2003
and net income increased 79 percent, due to lower provision for
credit losses of $317 million and an increase in equity investment
gains of $199 million. SVA increased by $287 million, or 354 per-
cent, as the increase in net income was partially offset by the impact
of an increase in capital levels. The increase in capital levels was
driven by additional goodwill recorded in mid-2002 representing final
contingent consideration in connection with the acquisition of the
remaining 50 percent of Marsico. All conditions related to this con-
tingent consideration have been met.
Client Assets
December 31
(Dollars in billions)
2003 2002
Assets under management
$335.7 $310.3
Client brokerage assets
88.8 90.9
Assets in custody
49.9 46.6
Total client assets
$474.4 $447.8
Assets under management, which consist largely of mutual funds,
equities and bonds, generate fees based on a percentage of their
market value. Compared to a year ago, assets under management
increased $25.4 billion, or eight percent, due to a $33.7 billion, or 41
percent, increase in equities, led by improved market valuations and
sales in assets advised by Marsico, offset by a decline of $13.2 bil-
lion, or eight percent, in money market assets. Client brokerage
assets, a source of commission revenue, decreased $2.1 billion, or
two percent. Client brokerage assets consist largely of investments
in bonds, annuities, money market mutual funds and equities. Assets
in custody increased $3.3 billion, or seven percent, and represent
trust assets administered for customers. Trust assets encompass a
broad range of asset types including real estate, private company
ownership interest, personal property and investments.
Net interest income remained relatively flat as growth in
deposits and increased loan spreads were offset by lower loan bal-
ances and the net results of ALM activities. Average loans and leases
decreased $773 million, or three percent, in 2003. Average deposits
increased $1.1 billion, or nine percent, in 2003.
Significant Noninterest Income Components
(Dollars in millions)
2003 2002
Asset management fees(1)
$1,160 $1,087
Brokerage income
420 435
Total investment and brokerage services
$1,580 $1,522
(1) Includes personal and institutional asset management fees, mutual fund fees and fees earned
on assets in custody.
Noninterest income increased $254 million, or 16 percent, in 2003
due to an increase in equity investment gains of $199 million related
to gains from securities sold that were received in satisfaction of
debt that had been restructured and charged off in prior periods and
higher asset management fees.
Provision for credit losses decreased $317 million, primarily due
to one large charge-off recorded in 2002.
Noninterest expense increased $120 million, or eight percent,
due to a $50 million allocation of the charge related to issues sur-
rounding our mutual fund practices, previously announced in the third
quarter of 2003 and increased expenses associated with the addi-
tion of financial advisors.
Global Corporate and Investment Banking
Our Global Corporate and Inve stme nt Banking strategy is to align our
resources with sectors where we can deliver value added financial
advisory solutions to our issuer and investor clients. As we broaden
and deepen our relationships with our strategic and priority clients, we
expect to build leading market shares that should provide our share-
holders sustainable revenue and SVA growth. Global Corporate and
Inve stme nt Banking provides a broad range of financial services to
domestic and international corporations, financial institutions, and
government entities. Clients are supported through offices in 30
countries in four distinct geographic regions: U.S. and Canada; Asia;
Europe, Middle East and Africa; and Latin America. Products and
services provided include loan origination, merger and acquisition
advisory, debt and equity underwriting and trading, cash manage-
ment, derivatives, foreign exchange, leasing, leveraged finance, struc-
tured finance and trade services.
Global Corporate and Inve stme nt Banking offers clients a
comprehensive range of global capabilities through three subseg-
ments: Global Inve stme nt Banking, Global Cre dit Products and Global
Tre asury Se rvice s.
Global Inve stme nt Banking includes our investment banking
activities and risk management products. Global Inve stme nt Banking
underwrites and makes markets for its clients in equity and equity-
linked securities, high-grade and high-yield corporate debt securities,
commercial paper, and mortgage-backed and asset-backed securities
as well as provides correspondent clearing services for other securi-
ties broker/dealers and prime-brokerage services. It also provides
debt and equity securities research, loan syndications, mergers and
acquisitions advisory services and private placements.
In addition, Global Inve stme nt Banking provides risk management
solutions for our global customer base using interest rate, equity,
credit and commodity derivatives, foreign exchange, fixed income and
mortgage-related products. In support of these activities, the busi-
nesses may take positions in these products and capitalize on mar-
ket-making activities. The Global Inve stme nt Banking business is a
primary dealer in the U.S. as well as in several international locations.
Global Cre dit Products provides credit and lending services for
our clients with our corporate industry-focused portfolios, which also
includes leasing. Global Cre dit Products is also responsible for
actively managing loan and counterparty risk in our large corporate
portfolio using available risk mitigation techniques, including credit
default swaps.
Global Tre asury Se rvice s provides the technology, strategies and
integrated solutions to help financial institutions, government agen-
cies and our corporate clients manage their operational cash flows
on a local, regional, national and global level.
Our financial performance continues to improve as total revenue
increased $256 million, or three percent, in 2003, due to increases in
investment banking income of $188 million, miscellaneous other
income of $160 million, service charges of $63 million and invest-
ment and brokerage service fees of $58 million. Net income increased
$451 million, or 29 percent. SVA increased by $732 million, or 292
percent, as a result of lower capital, the increase in net income and a
decrease in the capital charge related to improving credit quality
including a reduction in nonperforming assets.
Net interest income remained relatively flat at $4.8 billion.
Average loans and leases declined $13.8 billion, or 22 percent, in
2003, primarily as a result of either the client selection process or
refinancing by clients in the public markets as companies restruc-
tured their capital positions coupled with the lack of demand for addi-
tional bank debt as capital expenditures or inventory financing
continued to be moderate. Average deposits increased $1.4 billion,
or two percent, in 2003, despite decreases in compensating bal-
ances by the U.S. Treasury and foreign deposits.
Noninterest income increased $228 million, or six percent, in
2003, as increases in investment banking income, service charges,
and investment and brokerage services were partially offset by a
decline in trading account profits. Active market-based trading
account profits increased by $170 million; however, this was more
than offset by credit portfolio hedges that decreased by $414 million.
Investment banking income increased $188 million, or 13 per-
cent, in 2003. We continued to maintain syndicated lending and fixed
income market share and gained in areas such as mergers and
acquisitions, and mortgage-backed securities. Although the overall
market for securities underwriting declined for equity offerings, our
continued strong market share in equity offerings resulted in a 34
percent increase in securities underwriting fees.
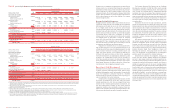
Investment Banking Income
(Dollars in millions)
2003 2002
Securities underwriting
$963 $721
Syndications
428 427
Advisory services
228 288
Other 50 45
Total
$1,669 $1,481
Investment and brokerage services income was $693 million and $636
million in 2003 and 2002, respectively. Service charges on accounts
were $1.2 billion for both periods.
Trading-related net interest income as well as trading account
profits in noninterest income (trading-related revenue) are presented
in the following table as they are both considered in evaluating the
overall profitability of our trading activities. Certain prior period
amounts have been reclassified among products to conform to the
current period presentation.
Trading-related Revenue
(Dollars in millions)
2003 2002
Net interest income (fully taxable-equivalent basis)
$2,214 $1,976
Trading account profits 588 832
Total trading-related revenue
$2,802 $2,808
Trading-related revenue by product
Fixed income
$1,371 $833
Interest rate (fully taxable-equivalent basis)
922 879
Foreign exchange
549 532
Equities(1)
337 386
Commodities
(47) 94
Market-based trading-related revenue
3,132 2,724
Credit portfolio hedges(2)
(330) 84
Total trading-related revenue
$2,802 $2,808
(1) Does not include commission revenue from equity transactions.
(2) Includes credit default swaps used for credit risk management.
Total trading-related revenue remained flat at $2.8 billion as the
$238 million increase in net interest income was offset by a $244
million decrease in trading account profits in 2003. This decrease in
trading account profits was principally attributable to the $414 million
decrease in revenue from credit portfolio hedges used as part of the
overall credit risk management process. For additional information on
credit portfolio hedges, see Concentrations of Credit Risk on page 45.
Market-based trading-related revenue increased by $408 million, or
15 percent, resulting from an increase of $538 million in fixed
income trading. Driving the increase in fixed income trading were
increased high-yield sales and trading activities of $283 million and
an increase of $23 million of sales and trading activities in mortgage-
backed securities. Interest rate sales and trading increased $43 mil-
lion due to general trading-related activities in the improving
economy. Offsetting this increase was a decline in commodities rev-
enue of $141 million primarily due to the adverse impact on jet fuel
prices from the SARS outbreak in the second quarter of 2003.
Equities also declined by $49 million, which was offset by an increase
of $63 million in trading commissions that was included in invest-
ment and brokerage services income. The growth in our overall trad-
ing reflects the strength of our debt sales and trading platform, which
capitalized on the tightening of credit spreads and stronger distribu-
tion capabilities in the investor market.
Continued improvements in credit quality in our large corporate
portfolio drove the $731 million, or 61 percent, decrease in provision
for credit losses. In 2003, net charge-offs of $690 million in the large
corporate portfolio were at their lowest levels in three years. Large
corporate nonperforming assets dropped $1.7 billion, or 57 percent,
in 2003, due to reduced levels of inflows of $2.3 billion, nonper-
forming loan sales of $1.4 billion, charge-offs of $841 million, and
paydowns and payoffs of $667 million.
Noninterest expense increased $372 million, or seven percent,
due to costs associated with downsizing operations in South America
and Asia and restructuring of locations within the United States of
$113 million, higher incentive compensation for market-based activi-
ties of $104 million, increased expenses from ongoing litigation and
litigation reserves of $74 million, and a $50 million allocation of the
charge related to issues surrounding our mutual fund practices.
36 BANK OF AMERICA 2003 BANK OF AMERICA 2003 37