Bank of America 2003 Annual Report Download - page 36
Download and view the complete annual report
Please find page 36 of the 2003 Bank of America annual report below. You can navigate through the pages in the report by either clicking on the pages listed below, or by using the keyword search tool below to find specific information within the annual report.-
 1
1 -
2
-
3
-
4
-
5
-
6
-
7
-
8
-
9
-
10
-
11
-
12
-
13
-
14
-
15
-
16
-
17
-
18
-
19
-
20
-
21
-
22
-
23
-
24
-
25
-
 26
26 -
 27
27 -
 28
28 -
 29
29 -
 30
30 -
 31
31 -
 32
32 -
 33
33 -
 34
34 -
 35
35 -
 36
36 -
 37
37 -
 38
38 -
 39
39 -
 40
40 -
 41
41 -
 42
42 -
 43
43 -
 44
44 -
 45
45 -
 46
46 -
47
-
48
-
49
-
50
-
51
-
52
-
53
-
54
-
55
-
56
-
57
-
58
-
59
-
60
-
61
 |
 |

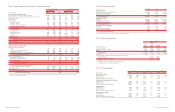
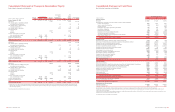
Table XVII
Non-exchange Traded Commodity Contracts
Asset Liability
(Dollars in millions)
Positions Positions
Net fair value of contracts outstanding, January 1, 2003
$1,464 $ 1,465
Effects of legally enforceable master netting agreements
3,452 3,452
Gross fair value of contracts outstanding, January 1, 2003
4,916 4,917
Contracts realized or otherwise settled
(2,543) (2,706)
Fair value of new contracts
2,218 2,005
Other changes in fair value
477 601
Gross fair value of contracts outstanding, December 31, 2003
5,068 4,817
Effects of legally enforceable master netting agreements
(3,344) (3,344)
Net fair value of contracts outstanding, December 31, 2003
$1,724 $ 1,473
Table XVIII
Non-exchange Traded Commodity Contract Maturities
December 31, 2003
Asset Liability
(Dollars in millions)
Positions Positions
Maturity of less than 1 year
$1,890 $ 2,027
Maturity of 1-3 years
2,075 1,796
Maturity of 4-5 years
627 509
Maturity in excess of 5 years
476 485
Gross fair value of contracts
5,068 4,817
Effects of legally enforceable master netting agreements
(3,344) (3,344)
Net fair value of contracts outstanding, December 31, 2003
$1,724 $ 1,473
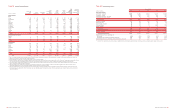
Table XIX
Selected Quarterly Financial Data
(Dollars in millions,
2003 Quarters 2002 Quarters
except per share information)
Fourth Third Second First Fourth Third Second First
Income statement
Net interest income
$5,586 $5,304 $ 5,365 $ 5,209 $ 5,374 $ 5,302 $ 5,094 $ 5,153
Noninterest income
4,043 4,439 4,255 3,685 3,430 3,220 3,481 3,440
Total revenue
9,629 9,743 9,620 8,894 8,804 8,522 8,575 8,593
Provision for credit losses
583 651 772 833 1,165 804 888 840
Gains on sales of debt securities
139 233 296 273 304 189 93 44
Noninterest expense
5,282 5,070 5,058 4,717 4,832 4,620 4,490 4,494
Income before income taxes
3,903 4,255 4,086 3,617 3,111 3,287 3,290 3,303
Income tax expense
1,177 1,333 1,348 1,193 497 1,052 1,069 1,124
Net income
2,726 2,922 2,738 2,424 2,614 2,235 2,221 2,179
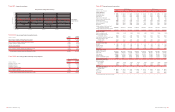
Average common shares issued and
outstanding (in thousands)
1,463,247 1,490,103 1,494,094 1,499,405 1,499,557 1,504,017 1,533,783 1,543,471
Average diluted common shares issued
and outstanding (in thousands)
1,489,481 1,519,641 1,523,306 1,526,288 1,542,482 1,546,347 1,592,250 1,581,848
Performance ratios
Return on average assets
1.39% 1.47% 1.42% 1.38% 1.49% 1.32% 1.38% 1.38%
Return on average common
shareholders’ equity
22.42 23.74 21.86 19.92 21.58 19.02 18.47 18.64
Total equity to total assets (period end)
6.52 6.84 6.63 7.36 7.61 7.30 7.48 7.76
Total average equity to total
average assets
6.19 6.22 6.49 6.92 6.91 6.97 7.46 7.43
Dividend payout
42.70 40.85 35.06 39.64 36.76 40.25 41.40 42.48
Per common share data
Earnings
$1.86 $1.96 $ 1.83 $ 1.62 $ 1.74 $ 1.49 $ 1.45 $ 1.41
Diluted earnings
1.83 1.92 1.80 1.59 1.69 1.45 1.40 1.38
Dividends paid
0.80 0.80 0.64 0.64 0.64 0.60 0.60 0.60
Book value
33.26 33.83 34.06 33.38 33.49 32.07 31.47 31.15
Average balance sheet
Total loans and leases
$371,071 $357,288 $350,279 $345,662 $343,099 $340,484 $335,684 $327,801
Total assets
780,534 786,153 775,084 713,780 695,935 669,607 647,245 638,276
Total deposits
418,840 414,569 405,307 385,760 381,381 373,933 365,986 364,403
Long-term debt(1)
70,596 66,788 68,927 67,399 65,702 64,880 65,940 67,694
Common shareholders’ equity
48,238 48,816 50,212 49,343 48,015 46,592 48,213 47,392
Total shareholders’ equity
48,293 48,871 50,269 49,400 48,074 46,652 48,274 47,456
Capital ratios (period end)
Risk-based capital:
Tier 1 capital
7.85% 8.25% 8.08% 8.20% 8.22% 8.13% 8.09% 8.48%
Total capital
11.87 12.17 11.95 12.29 12.43 12.38 12.42 12.93
Leverage
5.73 5.95 5.92 6.24 6.29 6.35 6.47 6.72
Market price per share of
common stock
Closing
$80.43 $78.04 $ 79.03 $ 66.84 $ 69.57 $ 63.80 $ 70.36 $ 68.02
High closing
82.50 83.53 79.89 72.48 71.42 71.94 76.90 69.18
Low closing
72.85 74.87 68.00 65.63 54.15 57.90 67.45 58.85
(1) Includes long-term debt related to Trust Securities.
68 BANK OF AMERICA 2003 BANK OF AMERICA 2003 69
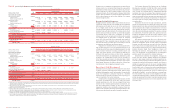
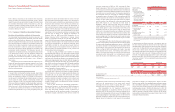
(Dollars in millions)
Daily VAR and Trading-related Revenue
12/31/02 3/31/03 6/30/03 9/30/03 12/31/03
Daily Trading-
related Revenue
VAR
-100
-80
60
0
-20
-40
-60
20
40
100
80
Table XVI
Trading Risk and Return